A custom BokehJS extension that visualizes 3D scatter points, lines and bars.
Free and open source code is here:
Simply download the folder, install bokeh numpy and run the EXAMPLES_3d.py.
Simple example:
import numpy as np
from bokeh.plotting import show, output_file
from scatter3d_py import Scatter3D

np.random.seed(42)
n_points = 200
x = np.random.randn(n_points) * 2
y = np.random.randn(n_points) * 2
z = np.random.randn(n_points) * 2

# Color based on distance from origin
colors = np.sqrt(x**2 + y**2 + z**2)

scatter1 = Scatter3D(
    x=x.tolist(),
    y=y.tolist(),
    z=z.tolist(),
    colors=colors.tolist(),
    palette='Viridis256',
    default_size=6.0,
    autorotate=False,
    rotation_speed=1.0,
    width=800,
    height=800,
    background_color='#0a0a0a',
    colorbar_title='Distance',
    show_colorbar=True,
    enable_hover=True,
)

output_file("scatter3d_basic.html", title="3D Scatter - Basic")
show(scatter1)
import numpy as np
from bokeh.plotting import show, output_file
from scatter3d_py import Scatter3D

n_per_cluster = 80
clusters = []
cluster_centers = [(0, 0, 0), (5, 5, 2), (-3, 4, -2)]
cluster_colors = [0, 1, 2]

x_all, y_all, z_all, colors_all = [], [], [], []
labels_all = []

for i, (cx, cy, cz) in enumerate(cluster_centers):
    x_cluster = np.random.randn(n_per_cluster) * 0.8 + cx
    y_cluster = np.random.randn(n_per_cluster) * 0.8 + cy
    z_cluster = np.random.randn(n_per_cluster) * 0.8 + cz

    x_all.extend(x_cluster)
    y_all.extend(y_cluster)
    z_all.extend(z_cluster)
    colors_all.extend([cluster_colors[i]] * n_per_cluster)
    labels_all.extend([f"Cluster {i+1}"] * n_per_cluster)

scatter3 = Scatter3D(
    x=x_all,
    y=y_all,
    z=z_all,
    colors=colors_all,
    labels=labels_all,
    palette='Set1',
    default_size=5.0,
    show_outline=True,
    outline_color='#ffffff',
    outline_width=1.0,
    autorotate=True,
    width=800,
    height=800,
    background_color='#0a0a0a',
    colorbar_title='Cluster',
    vmin=0,
    vmax=2,
)

output_file("scatter3d_clusters.html", title="3D Scatter - Clustered Data")
show(scatter3)
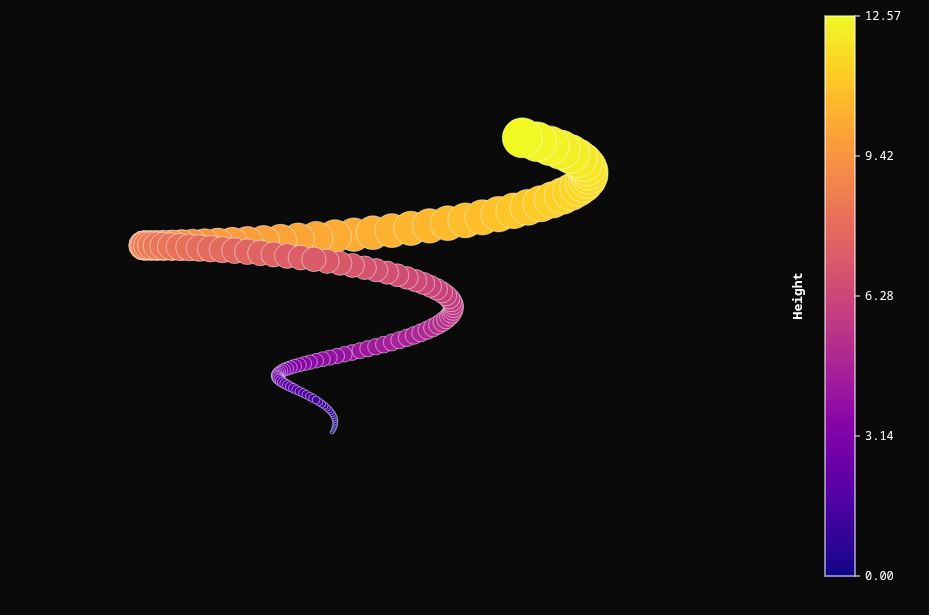
import numpy as np
from bokeh.plotting import show, output_file
from scatter3d_py import Scatter3D

t = np.linspace(0, 4*np.pi, 150)
x = t * np.cos(t)
y = t * np.sin(t)
z = t

# Size increases with time
sizes = t / t.max() * 10

scatter2 = Scatter3D(
    x=x.tolist(),
    y=y.tolist(),
    z=z.tolist(),
    colors=z.tolist(),
    sizes=sizes.tolist(),
    palette='Plasma256',
    min_size=2.0,
    max_size=20.0,
    autorotate=False,
    width=800,
    height=800,
    background_color='#0a0a0a',
    colorbar_title='Height',
    azimuth=60,
    elevation=25,
)

output_file("scatter3d_spiral.html", title="3D Scatter - Spiral with Variable Sizes")
show(scatter2)
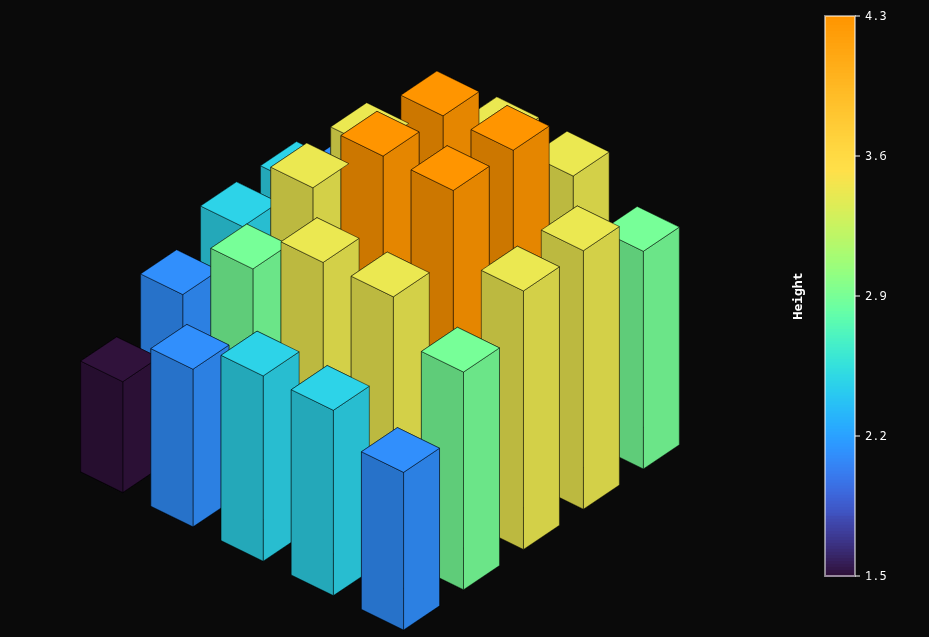
import numpy as np
from bokeh.plotting import show, output_file
from bar3d_py import Bar3D


n_x, n_y = 5, 5
x_grid = []
y_grid = []
values_grid = []

for i in range(n_x):
    for j in range(n_y):
        x_grid.append(i)
        y_grid.append(j)
        # Height based on distance from center
        dx = i - n_x/2
        dy = j - n_y/2
        values_grid.append(5 - np.sqrt(dx**2 + dy**2))

bar1 = Bar3D(
    x=x_grid,
    y=y_grid,
    values=values_grid,
    bar_width=0.6,
    bar_depth=0.6,
    palette='Turbo256',
    autorotate=True,
    width=800,
    height=800,
    background_color='#0a0a0a',
    colorbar_title='Height',
    elevation=-35,
    azimuth=50,
)

output_file("bar3d_grid.html", title="3D Bar Chart - Grid Pattern")
show(bar1)
import numpy as np
from bokeh.plotting import show, output_file
from line3d_py import Line3D

n_steps = 500
x = np.cumsum(np.random.randn(n_steps) * 0.1)
y = np.cumsum(np.random.randn(n_steps) * 0.1)
z = np.cumsum(np.random.randn(n_steps) * 0.1)

# Color by time/step
colors = np.arange(n_steps)

line3 = Line3D(
    x=x.tolist(),
    y=y.tolist(),
    z=z.tolist(),
    colors=colors.tolist(),
    palette='Plasma256',
    line_width=2.5,
    show_markers=True,
    marker_size=2.0,
    autorotate=True,
    width=800,
    height=800,
    background_color='#0a0a0a',
    colorbar_title='Time Step',
)

output_file("line3d_random_walk.html", title="3D Line - Random Walk")
show(line3)