A custom BokehJS extension for interactive 3D choropleth maps on a rotating globe. Visualize country-level data (population, GDP, emissions, etc.) with GeoJSON support, customizable discrete color bins, and multi-layer overlays. Features drag-to-rotate, auto-rotation, hover highlighting with tooltips, optional Phong lighting, and support for scatter points, 3D bars, flight routes, and satellite trajectories.
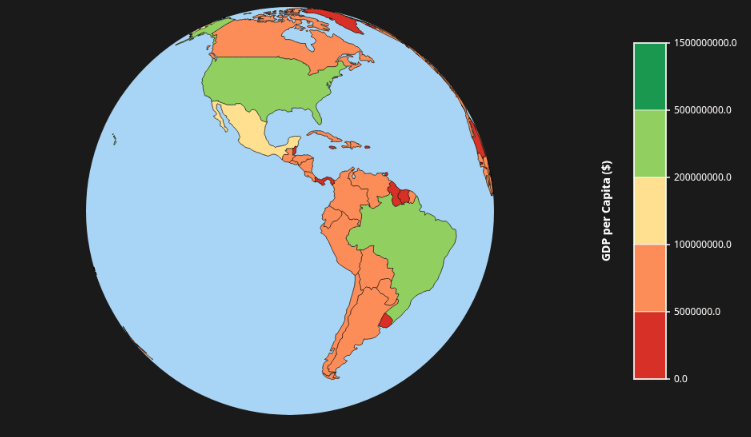
![]() GeoJSON choropleth rendering on 3D sphere
GeoJSON choropleth rendering on 3D sphere
![]() Custom discrete bins with user-defined colors & labels
Custom discrete bins with user-defined colors & labels
![]() Separate ocean/land/background colors
Separate ocean/land/background colors
![]() Hover highlighting with country name & value tooltips
Hover highlighting with country name & value tooltips
![]() Drag rotation/tilt, scroll zoom, auto-rotation
Drag rotation/tilt, scroll zoom, auto-rotation
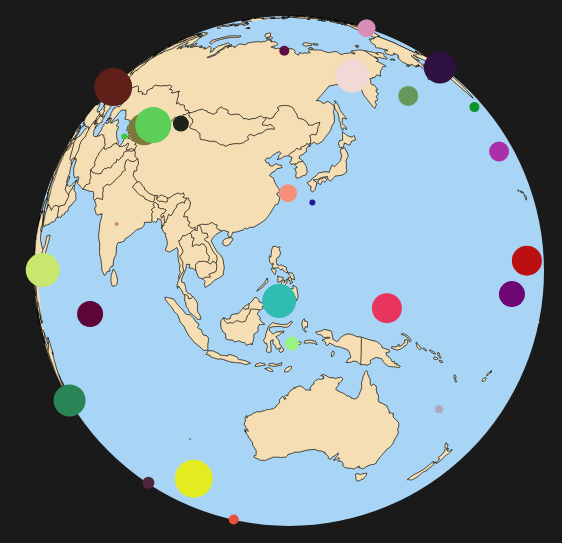
![]() Multi-layer overlays: scatter, 3D bars, lines, trajectories
Multi-layer overlays: scatter, 3D bars, lines, trajectories
![]() Optional Phong lighting for realistic shading
Optional Phong lighting for realistic shading
![]() Coastlines & country borders (optional)
Coastlines & country borders (optional)
Free and open source code is here:
Simply download the folder, install bokeh numpy pandas requests and xarray, and run the several examples.
from choropleth_sphere_py import ChoroplethSphere
from bokeh.plotting import show, output_file
from bokeh.plotting import show, output_file
import requests
import json
# Load world countries GeoJSON
url = "https://raw.githubusercontent.com/python-visualization/folium/master/examples/data/world-countries.json"
world_geo = requests.get(url).json()
from population_data import population_data

# Name mapping for countries with different names in GeoJSON
name_mapping = {
    "United States of America": "United States of America",
    # "Russia": "Russian Federation",
    # "South Korea": "Korea, Republic of",
    # "North Korea": "Dem. Rep. Korea",
    "Serbia": "Republic of Serbia",
    "Dem. Rep. Congo": "Democratic Republic of the Congo",
    "Congo": "Republic of the Congo",
    "Côte d'Ivoire": "Ivory Coast",
    "Tanzania": "United Republic of Tanzania",
}

# Apply name mapping
mapped_data = {}
for key, value in population_data.items():
    mapped_key = name_mapping.get(key, key)
    mapped_data[mapped_key] = value


geojson = {
    "type": "FeatureCollection",
    "features": []
}

for feature in world_geo["features"]:
    name = feature["properties"].get("name")

    # match population
    if name in mapped_data:
        new_feature = {
            "type": "Feature",
            "geometry": feature["geometry"],   # KEEP LAND SHAPE
            "properties": {
                "name": name,
                "value": mapped_data[name]     # ADD DATA
            }
        }
        geojson["features"].append(new_feature)

sphere3 = ChoroplethSphere(
    width=800,
    height=600,
    choropleth_data=geojson,
    choropleth_value_field="value",
    show_colorbar=True,
    colorbar_title="GDP per Capita ($)",
    custom_bins=[0.0, 5_000_000.0, 100_000_000.0, 200_000_000.0, 500_000_000.0, 1_500_000_000.0],
    custom_bin_colors=[
        "#d73027",  # Dark red - lowest GDP (0-5000)
        "#fc8d59",  # Orange-red (5000-15000)
        "#fee090",  # Light yellow (15000-30000)
        "#91cf60",  # Light green (30000-50000)
        "#1a9850",  # Dark green - highest GDP (50000-100000)
    ],
)
show(sphere3)
import random

def random_color():
    return "#{:02x}{:02x}{:02x}".format(
        random.randint(0, 255),
        random.randint(0, 255),
        random.randint(0, 255),
    )

scatter_data = [
    {
        "lon": random.uniform(-180, 180),
        "lat": random.uniform(-75, 75),   # avoid poles (better visuals)
        "size": random.randint(1, 20),
        "color": random_color(),
        "label": f"Point {i+1}"
    }
    for i in range(50)
]


sphere3 = ChoroplethSphere(
    width=800,
    height=600,
    choropleth_data=geojson,
    choropleth_value_field="value",
    show_colorbar=False,
    colorbar_title="GDP per Capita ($)",
    scatter_data=scatter_data,

    # Define custom bins for GDP categories
    custom_bins=[0.0,],
    enable_hover=False

)

show(sphere3)
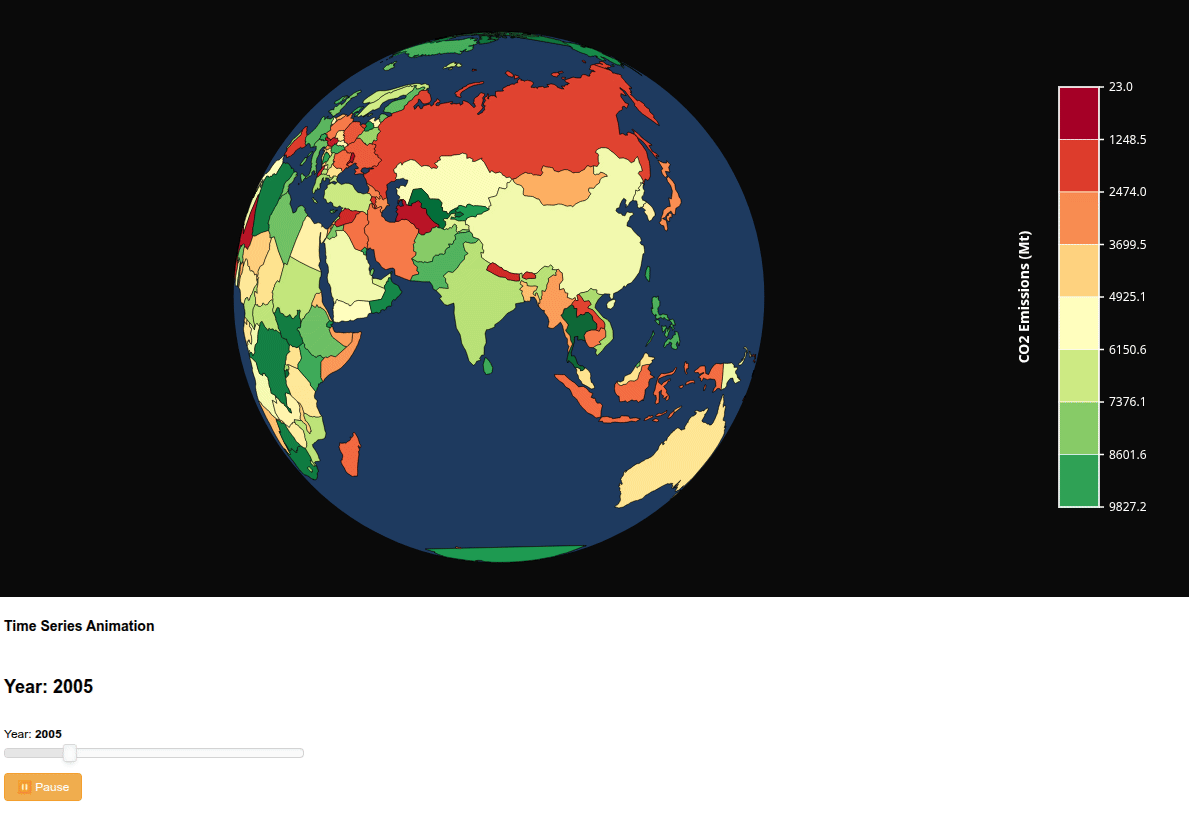
CustomJS interaction:
import json
import random
from bokeh.plotting import output_file, show
from bokeh.layouts import column
from bokeh.models import CustomJS, Slider, Button
from bokeh.models import Div

from choropleth_sphere_py import ChoroplethSphere

def example():
    """Animate data over time with a time slider"""

    with open('countries_tiny.geojson', 'r') as f:
        geojson = json.load(f)

    # Create time series data (e.g., CO2 emissions 2000-2023)
    years = list(range(2000, 2024))

    # Initialize with first year
    for feature in geojson['features']:
        feature['properties']['emissions'] = random.uniform(0, 10000)

    # Create sphere
    sphere = ChoroplethSphere(
        choropleth_data=geojson,
        choropleth_value_field="emissions",
        choropleth_palette="RdYlGn",  # Red = high, Green = low
        background_color="#0a0a0a",
        ocean_color="#1e3a5f",
        land_color="#2d2d2d",
        width=1000,
        height=600,
        show_colorbar=True,
        colorbar_title="CO2 Emissions (Mt)",
        enable_hover=True,
        autorotate=True,
        rotation_speed=0.3
    )

    # Year slider
    year_slider = Slider(start=2000, end=2023, value=2000, step=1, title="Year")

    # Store all years data in CustomJS
    year_callback = CustomJS(args=dict(sphere=sphere), code="""
        // Simulate time series data
        const year = cb_obj.value;
        const features = sphere.choropleth_data.features;

        // Update each country's value based on year
        for (let i = 0; i < features.length; i++) {
            const base = Math.random() * 10000;
            const growth = (year - 2000) * 100;
            const noise = (Math.random() - 0.5) * 1000;
            features[i].properties.emissions = base + growth + noise;
        }

        // Trigger update
        sphere.choropleth_data = {...sphere.choropleth_data};
    """)

    year_slider.js_on_change('value', year_callback)

    # Play button for animation
    play_button = Button(label="▶ Play Animation", button_type="success")

    play_callback = CustomJS(args=dict(slider=year_slider, button=play_button), code="""
        if (button.label.startsWith("▶")) {
            button.label = "⏸ Pause";
            button.button_type = "warning";

            const interval = setInterval(function() {
                if (slider.value >= slider.end) {
                    slider.value = slider.start;
                } else {
                    slider.value += 1;
                }

                if (button.label.startsWith("▶")) {
                    clearInterval(interval);
                }
            }, 500);  // Update every 500ms

            // Store interval ID
            window.animationInterval = interval;
        } else {
            button.label = "▶ Play Animation";
            button.button_type = "success";
            clearInterval(window.animationInterval);
        }
    """)

    play_button.js_on_click(play_callback)

    # Info display
    year_display = Div(text=f"<h2 style='text-align: center;'>Year: 2000</h2>")

    display_callback = CustomJS(args=dict(div=year_display), code="""
        div.text = "<h2 style='text-align: center;'>Year: " + cb_obj.value + "</h2>";
    """)
    year_slider.js_on_change('value', display_callback)

    # Layout
    controls = column(
        Div(text="<h3>Time Series Animation</h3>"),
        year_display,
        year_slider,
        play_button
    )

    layout = column(sphere, controls)

    output_file("example.html")
    show(layout)
example()