On Jun 19, 2018, at 19:22, [email protected] wrote:
Hi Bryan,
I tried to add like below
date_range_slider = DateRangeSlider(title="Date Range: ", start='2018-01-02', end='2018-06-09',
value
=('2018-06-02', '2018-06-09'), step=1)
# l = layout(children=[[date_range_slider]], sizing_mode='fixed')
l
= layout(children=[[p], [date_range_slider]], sizing_mode='fixed')
script
, div = components(l)
print(div)
return render(request, 'index.html', {"the_script": script, "the_div": div})
But I get error
bokeh-0.12.16.min.js:1 Uncaught Error: Model 'DateRangeSlider' does not exist. This
could be due to a widget
or a custom model not being registered before first usage.
Any idea why?
On Tuesday, June 19, 2018 at 3:40:38 PM UTC-5, Sandesh Kakade wrote:
Hi Bryan,
This is working great! I added couple more things as well.
I'm trying to add date slider something like
date_range_slider = DateRangeSlider(title="Date Range: ", start=date(2017, 1, 1), end=date.today(), value=(date(2017, 9, 7), date(2017, 10, 15)), step=1)
layout = row(p, date_range_slider)
But how do I pass layout to components or script or div
script, div = components(p)
return render(request, 'index.html', {"the_script": script, "the_div": div})
Any pointers are appreciated!!
On Tuesday, June 5, 2018 at 1:29:56 PM UTC-5, Sandesh Kakade wrote:
Thanks Bryan!!
I will give it a go with real data.
On Tuesday, June 5, 2018 at 11:32:45 AM UTC-5, Bryan Van de ven wrote:
Hi Sandesh,
All of bokeh.charts including "Area" was deprecated and removed last year. It was not a successful API and on top of that we did not have the resources to maintain it. The bokeh.plotting API has been considerably more stable over the years and is the primary recommended way to use Bokeh going forward.
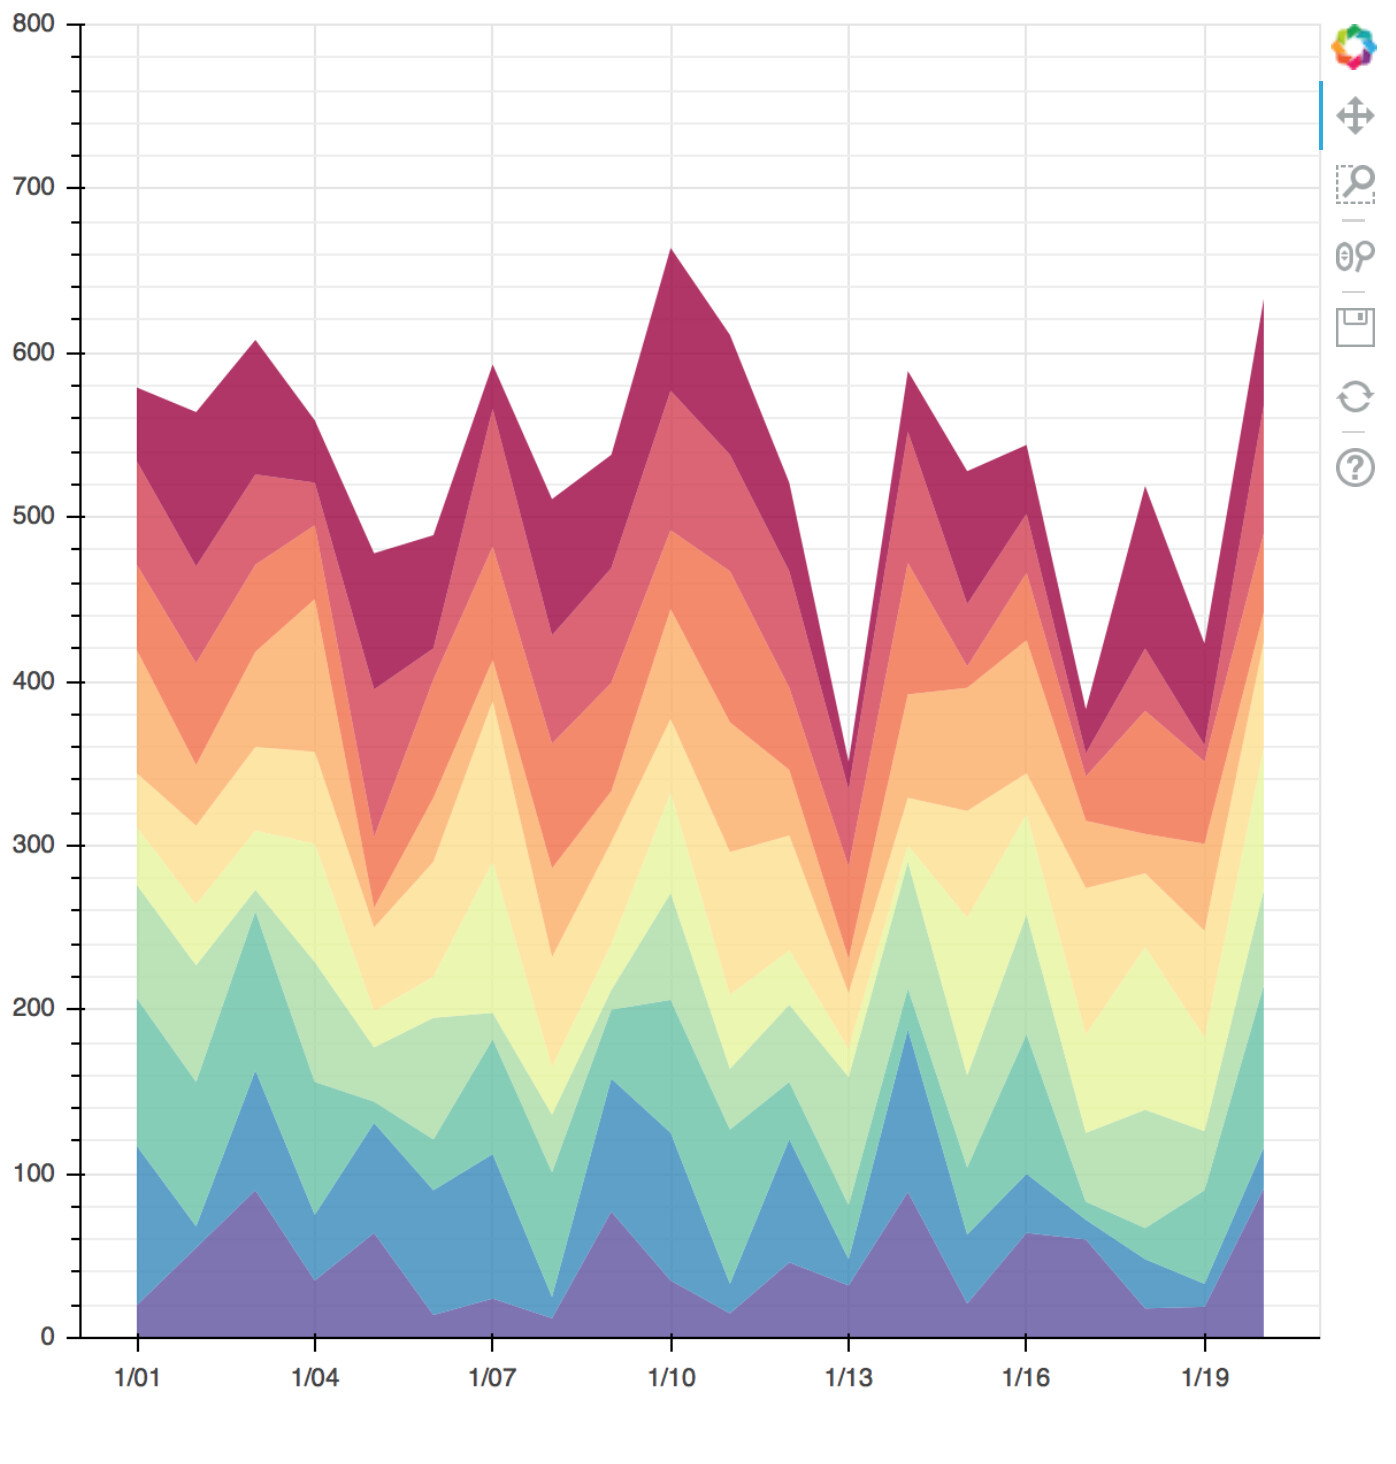
As for the OP, here is the brewer example updated to have dates on the x-axis. As I stated, the key to making that work is to use actual date values for the x-coordinates.
import numpy as np
import pandas as pd
from bokeh.plotting import figure, show, output_file
from bokeh.palettes import brewer

N = 20
cats = 10
df = pd.DataFrame(np.random.randint(10, 100, size=(N, cats))).add_prefix('y')

def stacked(df):
    df_top = df.cumsum(axis=1)
    df_bottom = df_top.shift(axis=1).fillna({'y0': 0})[::-1]
    df_stack = pd.concat([df_bottom, df_top], ignore_index=True)
    return df_stack

areas = stacked(df)

colors = brewer['Spectral'][areas.shape[1]]
# NOTE: use real date values for x-coordinates
x = pd.date_range('2018-01-01', '2018-01-20')
x2 = np.hstack((x[::-1], x))

p = figure(y_range=(0, 800), x_axis_type="datetime")
p.grid.minor_grid_line_color = '#eeeeee'

p.patches([x2] * areas.shape[1], [areas[c].values for c in areas],
        color=colors, alpha=0.8, line_color=None)

output_file('brewer.html', title='brewer.py example')

show(p)
On Jun 5, 2018, at 08:02, Sandesh Kakade <[email protected]> wrote:
Hi Brian,
Found similar example which uses patches with dates on x-axis, but that one also plots empty graph.
Looks like libraries has changed a lot within a year.
python - Displaying dates in x axis of Bokeh Area plot - Stack Overflow
On Mon, Jun 4, 2018 at 9:03 PM, Sandesh Kakade <[email protected]> wrote:
Hi Brian,
I am just trying to make sense of this tutorial https://bokeh.pydata.org/en/latest/docs/gallery/brewer.html
And how can I change that to `dates` on a x-axis, I have changed input data and trying to understand existing code so I can change it to dates.
On Mon, Jun 4, 2018 at 7:59 PM, Bryan Van de ven <[email protected]> wrote:
Sorry, I just don't understand what it is you are trying to really accomplish, i.e. at a high level, not in terms of code. You are trying to use patches, but you have a monotonically increasing list of x coordinates. This does not really ever make sense, because a patch typically needs to "loop back". What is it you actually want to do?
Thanks,
Bryan
> On Jun 4, 2018, at 16:39, bleedblue <[email protected]> wrote:
>
> Hi Bryan,
>
> Here is detail code.
> N = 4
>
> cats
> = 3
>
> data
> = [[2,3,4], [2,2,3], [0,0,0], [1,2,3]]
>
> df
> = pd.DataFrame(data, columns=['y0', 'y1', 'y2'])
>
>
>
> print
> df
> dates
> = ['2016-06-01','2016-06-02','2016-06-03','2016-06-04']
>
>
>
> def stacked(df):
>
> df_top
> = df.cumsum(axis=1)
>
> df_bottom
> = df_top.shift(axis=1).fillna({'y0': 0})[::-1]
>
> df_stack
> = pd.concat([df_bottom, df_top], ignore_index=True)
>
>
> return
> df_stack
>
> areas
> = stacked(df)
>
> colors
> = brewer['Spectral'][areas.shape[1]]
>
> x2
> = np.hstack((df.index[::-1], df.index))
>
> p
> = figure(x_range=(0, N-1), y_range=(0, 50))
> # p.xaxis.major_label_overrides = {
> # i: date.strftime('%b %d') for i, date in enumerate(pd.to_datetime(dates))
> # }
> # p.xaxis.bounds = (0, df.index[-1])
>
> p
> .grid.minor_grid_line_color = '#eeeeee'
>
>
> p
> .patches([x2] * areas.shape[1], [areas[c].values for c in areas],
>
> color
> =colors, alpha=0.8, line_color=None)
>
>
> output_file
> ('brewer.html', title='brewer.py example')
>
>
> show
> (p)
> So with above example I get x-axis 0,1,2,3 and I can zoom in.
>
> How do I change this to date. Can I do something like x_range=dates, just traverse over dates list. I tried with commented code but it doesn't update minor lables and I can't zoom in. Does dates has to be in
> df'?
> Currently my
> df is
>
> y0 y1 y2
>
> 0 2 3 4
> 1 2 2 3
> 2 0 0 0
> 3 1 2 3
> And if dates has to be in df I can add like below
>
> y0 y1 y2 date
>
> 0 2 3 4 2016-06-01
> 1 2 2 3 2016-06-02
> 2 0 0 0 2016-06-03
> 3 1 2 3 2016-06-04
> But still not sure how to plot these dates on x-axis.
>
>
> On Monday, June 4, 2018 at 3:40:07 PM UTC-5, Bryan Van de ven wrote:
> Hi,
>
> it's not the names of the columns that are important, it is the type. If you want to have a date time axis, then he column that you use for the x-coordinates of your data needs to have actual date time values. It doesn't right now, you are just passing junk like "2" which is not a date time value, why things are not working for you.
>
> Thanks,
>
> Bryan n
>
> > On Jun 4, 2018, at 13:36, bleedblue <[email protected]> wrote:
> >
> > I am following this example
> >
> > https://bokeh.pydata.org/en/latest/docs/gallery/brewer.html
> >
> > And I am trying convert x-axis to date format.
> >
> > I found similar problem but that doesn't seem to work.
> >
> > python - Bokeh patches plot with dates as x-axis shifts the ticks one to the right - Stack Overflow
> >
> > As per this example
> > https://bokeh.pydata.org/en/latest/docs/user_guide/plotting.html#datetime-axes
> >
> > `df` has columns `date`, `close` etc.
> >
> > I can change column names for `df` data from brewer.py
> > e.g. sample data
> > y0 y1 y2
> > 0 2 3 4
> > 1 2 2 3
> > 2 0 0 0
> > 3 1 2 3
> >
> > using df = pd.DataFrame(data, columns=['date', 'y1', 'y2'])
> >
> > But not sure how to make appropriate changes for areas = stacked(df) and p.patches(..)
> >
> > How can I skip `date` column in `def stacked` and add `x_range` as date?
> >
> > --
> > You received this message because you are subscribed to the Google Groups "Bokeh Discussion - Public" group.
> > To unsubscribe from this group and stop receiving emails from it, send an email to bokeh+un...@continuum.io.
> > To post to this group, send email to bo...@continuum.io.
> > To view this discussion on the web visit https://groups.google.com/a/continuum.io/d/msgid/bokeh/869d77d7-6d92-4311-b513-9d7246a4262f%40continuum.io\.
> > For more options, visit https://groups.google.com/a/continuum.io/d/optout\.
>
>
> --
> You received this message because you are subscribed to the Google Groups "Bokeh Discussion - Public" group.
> To unsubscribe from this group and stop receiving emails from it, send an email to bokeh+un...@continuum.io.
> To post to this group, send email to bo...@continuum.io.
> To view this discussion on the web visit https://groups.google.com/a/continuum.io/d/msgid/bokeh/69959b84-798e-4c04-8345-2ec138a73101%40continuum.io\.
> For more options, visit https://groups.google.com/a/continuum.io/d/optout\.
--
You received this message because you are subscribed to a topic in the Google Groups "Bokeh Discussion - Public" group.
To unsubscribe from this topic, visit https://groups.google.com/a/continuum.io/d/topic/bokeh/_Yq7VeFaLig/unsubscribe\.
To unsubscribe from this group and all its topics, send an email to bokeh+un...@continuum.io.
To post to this group, send email to bo...@continuum.io.
To view this discussion on the web visit https://groups.google.com/a/continuum.io/d/msgid/bokeh/8B3F5905-FC4D-4EED-AA30-CB13E8775D9C%40anaconda.com\.
For more options, visit https://groups.google.com/a/continuum.io/d/optout\.
--
You received this message because you are subscribed to the Google Groups "Bokeh Discussion - Public" group.
To unsubscribe from this group and stop receiving emails from it, send an email to bokeh+un...@continuum.io.
To post to this group, send email to bo...@continuum.io.
To view this discussion on the web visit https://groups.google.com/a/continuum.io/d/msgid/bokeh/CAACib3CcvwV_bFkaUXBKvWjBJit3byb1B-sQcD0Ez0BGPXygZA%40mail.gmail.com\.
For more options, visit https://groups.google.com/a/continuum.io/d/optout\.
--
You received this message because you are subscribed to the Google Groups "Bokeh Discussion - Public" group.
To unsubscribe from this group and stop receiving emails from it, send an email to [email protected].
To post to this group, send email to [email protected].
To view this discussion on the web visit https://groups.google.com/a/continuum.io/d/msgid/bokeh/c891a5eb-374f-4f36-95fb-c1322c960caf%40continuum.io\.
For more options, visit https://groups.google.com/a/continuum.io/d/optout\.