I’m trying to build a legend for the above hbar plot. The data used to generate the plot is stored in two columns, one with a number, the other with a colour.
The call to the function to build this figure (p8) is here, where df_data is a large dataframe, the column with the hbar numbers is SBTn and the colours are set by SBTn colour:
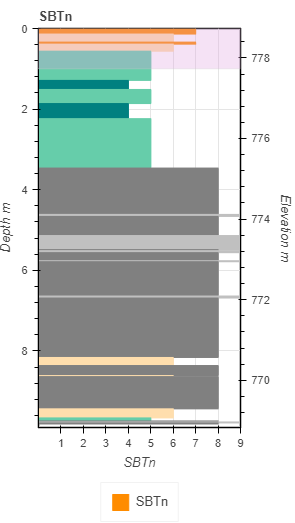
p8 = figure(title="SBTn", x_axis_label="SBTn", y_axis_label="Depth m", plot_width=std_plot_width,
                plot_height=std_plot_height, x_range=(0, 9), y_range=(depth_max, 0))
    if elevation_num > 0:
        elevation_bottom = elevation_num - depth_max
        p8.extra_y_ranges = {"foo": Range1d(start=elevation_bottom, end=elevation_num)}
        p8.add_layout(LinearAxis(y_range_name="foo", axis_label='Elevation m'), 'right')
    plot_helper(p8,
                [['SBTn', 'Depth m', 'black', 'SBTn', 'solid', 'hbar', df_data[['Depth m', 'SBTn', 'SBTn colour']]]],
                depth_highlight)
    p8.xaxis.ticker = [1, 2, 3, 4, 5, 6, 7, 8, 9]
I have a function to build the hbar (and other plots) as need be in the code.
def plot_helper(figure, data_set, box_ann):
    # Plots data in a Bokeh plot
    # data_set indicies 0 - x dataframe title 1 - y dataframe title 2 - plot colour 3 - legend title, 4 - line type (line) or symbol size (symbol)
    # 5 - plot type
    plots = []  # empty list to hold plots
    legend_items = []  # emply list to hold legend titles
    for i in range(0, len(data_set)):
        # Loop through each item to be plotted
        df = data_set[i][6]  # get dataframe information
        # if df_data.empty == False: # if no data is passed don't generate a plot
        if data_set[i][5] == 'line':
            plots.append(figure.line(x=data_set[i][0], y=data_set[i][1], source=df, color=data_set[i][2],
                                     line_dash=data_set[i][4]))
        elif data_set[i][5] == 'symbol':
            plots.append(figure.square(x=data_set[i][0], y=data_set[i][1], source=df, color=data_set[i][2],
                                       size=data_set[i][4]))
        elif data_set[i][5] == 'hbar':
            plots.append(figure.hbar(y=data_set[i][1], height=0.025, right=data_set[i][0], color=df.columns.values[-1],
                                     source=df))
        legend_items.append((data_set[i][3], [plots[i]]))  # add item to the legend
    if box_ann != '':
        box_highlight = BoxAnnotation(bottom=box_ann[0], top=box_ann[1], fill_alpha=0.3, fill_color='plum')
        figure.add_layout(box_highlight)

    # figure.y_range.flipped = True # flip the y axis, assumes it's depth
    legend_plot = Legend(items=legend_items, location="center")  # create the legend
    figure.add_layout(legend_plot, 'below')  # add it to the plot
    figure.legend.click_policy = "hide"  # plots will turn off when clicked on
    figure.outline_line_width = 1.5  # draw an outline around the plot
    figure.outline_line_color = 'black'
The legend I get now isn’t very useful. I tried to build an additional legend but I can’t figure out how to get the glyphs to be recognized since they’re not in the figure.
legend_items = [LegendItem(label="Non-Cohesive", index=0, renderers=Line(line_color="tomato", line_width=2))]
    legend_plot = Legend(items=legend_items, location="center")  # create the legend
    p8.add_layout(legend_plot, 'below')  # add it to the plot
This gives the following error
ValueError: failed to validate LegendItem(id='3087', ...).renderers: expected an element of List(Instance(GlyphRenderer)), got Line(id='3086', ...)
Which makes sense since the line glyph isn’t in the hbar plot