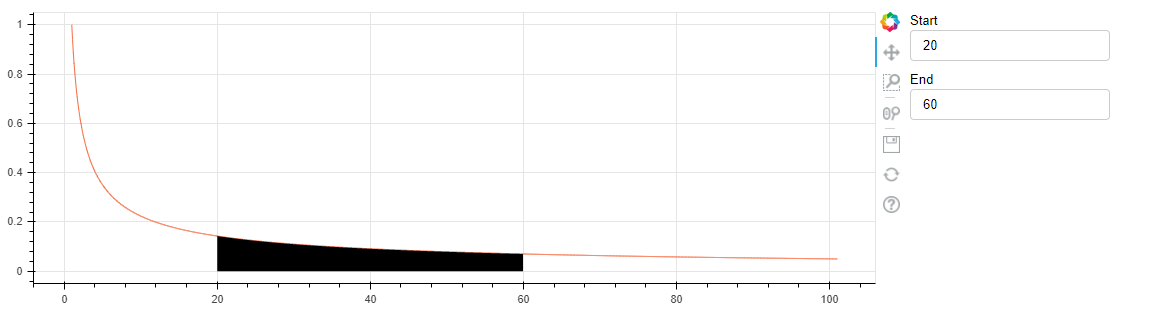
Is there a way to calculate the area under the graph for user input start and end? And also have the varea color from selected values. I tried something below, but not sure how to have the code only iterate between start and end. Also not entirely sure how to change the colored area under the graph. Anyone have a clue?
import numpy as np
from bokeh.models import ColumnDataSource, Grid, LinearAxis, Plot, VArea, TextInput, CustomJS
from bokeh.layouts import column, row
from bokeh.plotting import show, figure

t = np.linspace(1, 101, 100)
A, n = 1, -0.65
y1 = np.zeros(100)
y2 = A*np.power(t, n)
source = ColumnDataSource(dict(t=t, y1=y1, y2=y2))

start = TextInput(value="0", title="Start", width = 200)
end = TextInput(value="100", title="End", width = 200)

callback = CustomJS(args=dict(source=source,
                             start = start,
                             end = end), code="""
    var data = source.data
    var t1 = start.value
    var t2 = end.value

    const closest = data.t.reduce((a, b) => {
        return Math.abs(b - t1) < Math.abs(a - t1) ? b : a;
        });
    console.log(closest);

    var area = 0;
    var height = 1;
    console.log(t1, t2)
    for (var i = 0; i < (data.t.length - 1); i++) {
        console.log(data.y2[i+1], data.y2[i], data['y2'][i], 0.5 * (data.y2[i + 1] + data.y2[i]) * height)
        area += 0.5 * (data.y2[i + 1] + data.y2[i]) * height;
    }
    console.log(area)

    source.change.emit()
""")

start.js_on_change('value', callback)
end.js_on_change('value', callback)

plot = figure(title=None, plot_width=900, plot_height=300)

plot.varea(x="t", y1="y1", y2="y2", fill_color="#f46d43", source = source)

show(row(plot, column(start, end)))