Hi Roman
The bokeh.charts API is very high level, which means it tries to do alot of things for you “automatically”, but that also means that some things are more constrained. In this case, the data you pass in has to be processed to generate rendering data for the Chart, so the data you pass in is a “step removed” from what actually has to get sent to BokehJS. The upshot is that you can’t pass in extra columns like that for bokeh.charts (AFAIK).
But there is a slightly more verbose bokeh.plotting API that offers more control and flexibility. Here the data that you give drives the plot in a one-to-one way, so there’s no problem adding new columns and Bokeh knowing how to use them. I’ve attached a working version of your plot below. The main slightly crappy part is the “by hand” colormapping, we still need to add color mapping functions to the python side of the library.
Thanks,
Bryan
import pandas as pd
from math import floor
from bokeh.plotting import figure, output_file, show
from bokeh.models import HoverTool, ColumnDataSource
from bokeh.palettes import RdYlBu11 as palette
output_file(‘heatmap.html’)
df = pd.read_csv(“test_data.csv”)
X = df.X.values
Y = df.Y.values
Count = df.Count.values
Desc = df.Desc.values
data = {‘X’:X,‘Y’:Y,‘count’:Count, ‘desc’:Desc}
colormap by hand for now, a one-liner some day
N, min, max = len(palette), Count.min(), Count.max()
data[‘color’] =
for x in data[‘count’]:
ind = floor((x-min)/(max-min)*(N-1))

data['color'].append(palette[ind])
source = ColumnDataSource(data)
hover = HoverTool(
tooltips=[("description", "@desc"), ("count", "@count")]
)
hm = figure(title=‘test data’, tools=[hover,“crosshair”,“pan”,“box_zoom”,“wheel_zoom”,“reset”,“resize”,“save”])
hm.rect(x=‘X’, y=‘Y’, width=1, height=1, fill_color=‘color’, line_color=“white”, source=source)
show(hm)
On May 8, 2016, at 4:27 PM, [email protected] wrote:
Greetings!
My own ignorance is probably to blame but I am running into an issue with HoverTool and HeatMap.
I have a dataset in a csv file that provides information on each individual datapoint: an (x,y) coordinate, an integer value (denoted as “Count”), and a text description (denoted as “Desc”).
This dataset is intended to be plotted as a square matrix using HeatMap. While I am able to get HoverTool to show me the integer value (Count) associated with each (x,y) point, I cannot seem to figure out how to get HoverTool to show me the description (Desc) as well. Do you have any suggestions?
I have attached the code I am using as well as a sample data file.
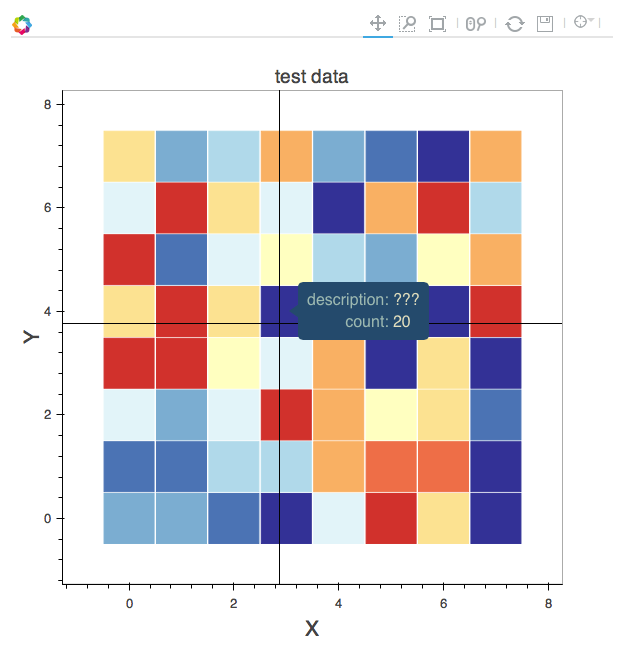
I also attached a screenshot of my output heatmap. The “description” part of the hovertool just shows “???” rather than the text contained in the Desc column of the csv file.
I am using pandas 0.18.0-7 and bokeh 0.11.1
Thank you very much!
Roman
–
You received this message because you are subscribed to the Google Groups “Bokeh Discussion - Public” group.
To unsubscribe from this group and stop receiving emails from it, send an email to [email protected].
To post to this group, send email to [email protected].
To view this discussion on the web visit https://groups.google.com/a/continuum.io/d/msgid/bokeh/356b1bd3-af15-4e2e-9987-41d3b2b0cf64%40continuum.io.
For more options, visit https://groups.google.com/a/continuum.io/d/optout.
<heatmap_help.py><test_data.csv><Screen Shot 2016-05-08 at 11.23.06 AM.png>