Candles update from bokeh-stream function per Hour/Minute inteval giving error

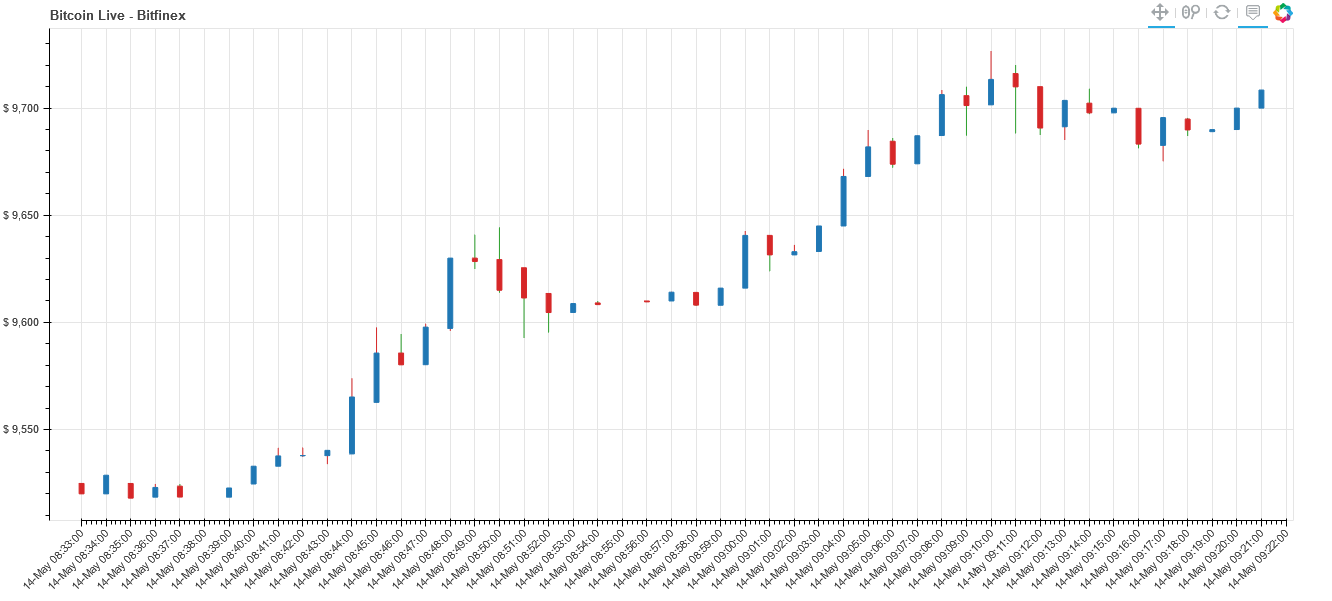
Hi. I’m new to bokeh - on a steep learning curve- Love bokeh and its power though… I’m pulling live data from Bitfinex and saving it to csv with chosen interval required for live streamed plotting. Data seems fine as the candles do plot perfectly with manually refreshing the browser though. As a note, my csv file is not “appending data” it rewrites the full set of data every few seconds… don’t know if the problem sits here perhaps…

My “update_data” stream function does not update my plot automatically. so i have to refresh every minute :slight_smile:

I’m getting following error from the bokeh serve --show app and cant seem to get behind the problem:

“Must stream updates to all existing columns (missing: %s)” % ", ".join(sorted(missing)))
ValueError: "Must stream updates to all existing columns (missing: level_0)

Please can someone help that my candles can update automatically?

Code below:

###Data CSV file looks like:
###############################################################
Date,Open,High,Low,Close,Volume
2020-05-13 17:37:00,9073.25943776,9073.25943776,9073.2,9073.2,0.23892929000000002
2020-05-13 17:38:00,9073.234011,9073.234011,9073.2,9073.2,0.75118941
2020-05-13 17:39:00,9066.5,9073.19340014,9063.0,9073.19340014,3.75187717
2020-05-13 17:40:00,9072.6,9072.7,9066.4,9066.8,0.14512834
2020-05-13 17:41:00,9065.5,9065.5,9065.4,9065.4,0.07300000000000001
2020-05-13 17:42:00,9065.4,9065.40283649,9052.8,9055.0,1.2116440400000001
2020-05-13 17:43:00,9052.20215918,9054.1,9052.0,9054.1,0.5493773
2020-05-13 17:44:00,9052.4,9055.1,9052.4,9055.0,0.47964840000000003
2020-05-13 17:45:00,9055.1,9055.1,9053.2,9055.1,1.31410793
and continues with with max 121 entries at all times with latest current data at the end of the file
################################################################

import pandas as pd # data processing, CSV file I/O (e.g. pd.read_csv)
import os
from bokeh.plotting import figure, ColumnDataSource
from bokeh.models.widgets import Dropdown
from bokeh.io import curdoc
from bokeh.layouts import column

from bokeh.models import BooleanFilter, CDSView, Select, Range1d, HoverTool
from bokeh.palettes import Category20
from bokeh.models.formatters import NumeralTickFormatter 

###Define BOKEH constants below
###########################

W_PLOT = 1300
H_PLOT = 600
TOOLS = 'pan,wheel_zoom,hover,reset'

VBAR_WIDTH = 0.2
RED = Category20[7][6]
GREEN = Category20[5][4]

BLUE = Category20[3][0]
BLUE_LIGHT = Category20[3][1]

ORANGE = Category20[3][2]
PURPLE = Category20[9][8]
BROWN = Category20[11][10]

Python function below to collect data from csv file to format as above file extract

def  get_symbol_df(symbol=None):
   df = pd.DataFrame(pd.read_csv('D_Crypto_Bitfinance/' + symbol + '.csv'))[-50:]
   #df.reset_index(inplace=True)
   df["Date"] = pd.to_datetime(df["Date"])
   return df

Python Function to plot stock

def plot_stock_price(stock):
    p = figure(plot_width=W_PLOT, plot_height=H_PLOT, tools=TOOLS,
    title="Bitcoin Live - Bitfinex", toolbar_location='above')
    #####
    inc = stock.data['Close'] > stock.data['Open']
    dec = stock.data['Open'] > stock.data['Close']
    view_inc = CDSView(source=stock, filters=[BooleanFilter(inc)])
    view_dec = CDSView(source=stock, filters=[BooleanFilter(dec)])
    ###
    # map dataframe indices to date strings and use as label overrides even during zoom in function
    p.xaxis.major_label_overrides = {  #'%b %d
        i+int(stock.data['index'][0]): date.strftime( '%d-%b %H:%M:%S' ) for i, date in enumerate(pd.to_datetime(stock.data["Date"]))
    }
    p.xaxis.bounds = (stock.data['index'][0], stock.data['index'][-1])
    p.segment(x0='index', x1='index', y0='Low', y1='High', color=RED, source=stock, view=view_inc)
    p.segment(x0='index', x1='index', y0='Low', y1='High', color=GREEN, source=stock, view=view_dec)
    p.vbar(x='index', width=VBAR_WIDTH, top='Open', bottom='Close', fill_color=BLUE, line_color=BLUE,
           source=stock,view=view_inc, name="price")
    p.vbar(x='index', width=VBAR_WIDTH, top='Open', bottom='Close', fill_color=RED, line_color=RED,
           source=stock,view=view_dec, name="price")
    ####LEGEND####
   # p.legend.location = "top_left"
   #p.legend.border_line_alpha = 0
   # p.legend.background_fill_alpha = 0
   # p.legend.click_policy = "mute"
    ####-Y - AXIS FORMATTER####
    p.yaxis.formatter = NumeralTickFormatter(format='$ 0,0[.]000')
    p.x_range.range_padding = 0.05
    p.xaxis.ticker.desired_num_ticks = 40
    p.xaxis.major_label_orientation = 3.14/4
    ####
    #Select specific tool for the plot#
    price_hover = p.select(dict(type=HoverTool))

    #Choose, which glyphs are active by glyph name#
     price_hover.names = ["price"]
   
    #Creating tooltips#
     price_hover.tooltips = [("Datetime", "@Date{%Y-%m-%d}"),
                            ("Open", "@Open{$0,0.00}"),
                            ("Close", "@Close{$0,0.00}"),
                           ("Volume", "@Volume{($ 0.00 a)}")]
     price_hover.formatters={"Date": 'datetime'}
     return p

##Bokeh Magic###

stock = ColumnDataSource(data=dict(Date=[   ], Open=[  ], High=[  ], Low=[  ], Close=[  ], Volume = [  ], index=[  ]))
symbol = 'read'
df = get_symbol_df(symbol)
stock.data = stock.from_df(df)
elements = list()
# First try update- error code relating to Must stream updates to all existing columns (missing: %s)" % #", ".join(sorted(missing)))
# ValueError: "Must stream updates to all existing columns (missing: level_0)

def update_data( ):
         new_data = dict(Date=[  ],Open=[  ], High = [  ], Low = [  ],Close=[  ], Volume=[  ], index = [  ])

      ##new_data["Date"] = pd.to_datetime(new_data["Date"]) 
         
      ##After 10 seconds rollover the data
         stock.stream(new_data=new_data, rollover=10)

# Second try update  - different error codes relating to dataframe issues
#def update_data():
#    new_data = get_symbol_df()
#    stock.stream(dict(Date=new_data["Date"],
#                     Open=new_data["Open"],
#                    High=new_data['High'],
#                     Low=new_data['Low'],
#                     Close=new_data['Close']),
#                     1000, rollover=10)


###update_plot()###
p_stock = plot_stock_price(stock)

   
elements.append(p_stock)

curdoc().add_root(column(elements))
curdoc().title = 'Bitcoin Live Data Plot'
curdoc().add_root( p )

###Update the data every 10seconds (1000*10 ms)
curdoc().add_periodic_callback(callback=update_data, period_milliseconds=1000 * 10)

Hi @BrothersGrimm please edit your post to use code formatting so that the code is intelligible (either with the </> icon on the editing toolbar, or triple backtick ``` fences around the code blocks)

Hi Bryan,

Updated as requested. Thanks so far.

The error complains about the level_0 column which neither your code nor your data have or can produce. Either the data or the code you have provided is wrong/incomplete.

Hi. I doubt that its the data. Otherwise the candles would not have plotted like it did…seamlessly once I manually update my browser on demand… I think more that its the function that pulls data through the column-datasource. I have tried multiple functions to update automatically of which none works either way…

I don’t seem to get around the column-datasource function. I tried to update only last line from csv file each time, but this also does not work…missing something with my functions to update the candles.

Does anyone have a simple example “function” of how candles update is achieved with a periodic callback from a csv file? Or either with the CSV appending info, or rewriting all existing info each time of update…

Please…

I cannot really help you because your example does not run without modifications. And if I try to fix it myself, I have no idea whether I change something that you didn’t want to be changed. With that being said, please don’t split a single example into multiple sections - it makes it much harder to copy.

Some comments based on some of the things you said:

As a note, my csv file is not “appending data” it rewrites the full set of data every few seconds… don’t know if the problem sits here perhaps…

It doesn’t matter what you do with the CSV file. What matters is what you want and what you do with Bokeh. If you want the new data to be added to the plot, use stream. If you want the new data to replace the old one, just override the data attribute.

You don’t do it now, but it seems that you will need to call get_symbol_df in your callback.

Don’t set p.xaxis.bounds if your dates change (I assume you index the data by Date, although the code doesn’t show it) - it will prevent the automatic ranging when you update the data.

Same with p.xaxis.major_label_overrides - just set a formatter instead.

And finally, the most general and IMO the most valuable advice - start small. Don’t try to solve the task at hand right away. Instead, split the task into smaller chunks and solve those chunks one by one. Right now, the problem is updating the data. So don’t try to solve it within the confines of a larger task of creating an updating candle chart. Start with a small chart that’s updated from some random data generated in runtime.

Hi. Ok. Started from scratch. Not all my own code though, but works like a dream for updating live and plotting live from any source through the colum-data-source periodical call back with x and y only. I tested it with my csv file as well with “close” value only and works perfectly meaning that nothing is wrong with my data…

I need help now on formulating the function to update OHLC through columndatasource from any source for that matter.See previous post of mine with functions. I keep on having server errors…

Included is a web scrape obtaining live data latest price for now for ease of testing. However only Open, High, Low, Close data can form the candles of course…

If anyone out there has an simple example to update the candles automatically in line with the attached code below I would be grateful …I am so tired of trying options to make this work. Feel like changing to another plotter rather at this stage if i cannot get this to work in the next few days. There are ZERO examples out there for candles update…

Eugene,

If you can come up with a example that works on updating OHLC periodically in line with the below code in the next 5 days, I could have 4 beers delivered to your front door…“after covid 19 lock down” of course :slight_smile:

Thanks for your comments so far.

Copy paste and run for testing.

See adjusted simple code below:

from bokeh.layouts import row
from bokeh.io import curdoc
from bokeh.models import ColumnDataSource, DatetimeTickFormatter, Select
from bokeh.layouts import layout
from bokeh.plotting import figure
from random import randrange
import requests
from bs4 import BeautifulSoup
from datetime import datetime
from math import radians
from pytz import timezone
import pandas as pd
TOOLS = 'pan,wheel_zoom,hover,reset'

#create figure
# f=figure(x_axis_type='datetime')
f = figure(x_axis_type='datetime', plot_width=1300, plot_height=600, tools=TOOLS,
               title="Bitcoin Live - Bitstamp", toolbar_location='above')


#def extract_value(): # value from csv my files works like dream!
    
#    df = pd.read_csv('C:/Users/Private/Datafactory/A _Datafactory_CSV_output/D_Crypto/D_Crypto_Bitfinance/read.csv')
#    Date = df["Date"] = pd.to_datetime(df["Date"])
#    df.set_index('Date')
#    value_net = df['Close'].values[-1].tolist()  # Have to change datatype from numpy.float64 to #float with (tolist() command)
#    return value_net

#print(type(extract_value())) 
#print (extract_value())

#####with web scraping function to test by yourself for live plotting. Just un-comment this one and #comment the one above and run bokeh serve --show **.py in command line.  

def extract_value():
     r=requests.get("http://bitcoincharts.com/markets/bitstampUSD.html",headers={'User-Agent':'Mozilla/5.0'})
     c=r.content
     soup=BeautifulSoup(c,"html.parser")
     value_raw=soup.find_all("p")
     value_net=float(value_raw[0].span.text)
     return value_net

   print (extract_value())


# df = pd.read_csv('C:/Users/Private/Datafactory/A _Datafactory_CSV_output/D_Crypto/D_Crypto_Bitfinance/read.csv')
# Date = df["Date"] = pd.to_datetime(df["Date"])
# inc = df.Close.values[-1].tolist() > df.Open.values[-1].tolist()
# dec = df.Open.values[-1].tolist() > df.Close.values[-1].tolist()

#create ColumnDataSource
source=ColumnDataSource(dict(x=[ ],y=[ ]))

#create glyphs
f.circle(x='x', y= 'y',color='olive',line_color='brown',source=source)
f.line(x='x',y='y',source=source)


#create periodic function
def update():
    # new_data=dict(x=[datetime.now(pytz.utc)],y=[extract_value()])
    new_data=dict(x=[datetime.now(tz=timezone('Africa/Windhoek'))],y=[extract_value()])
    source.stream(new_data,rollover=200)
    print(source.data)

def update_intermediate(attr, old, new):
    source.data=dict(x=[],y=[])
    update()


f.xaxis.formatter=DatetimeTickFormatter(
seconds=["%Y-%m-%d-%H-%m-%S"],
minsec=["%Y-%m-%d-%H-%m-%S"],
minutes=["%Y-%m-%d-%H-%m-%S"],
hourmin=["%Y-%m-%d-%H-%m-%S"],
hours=["%Y-%m-%d-%H-%m-%S"],
days=["%Y-%m-%d-%H-%m-%S"],
months=["%Y-%m-%d-%H-%m-%S"],
years=["%Y-%m-%d-%H-%m-%S"],
)

f.xaxis.major_label_orientation=radians(25)

#add figure to curdoc and configure callback
lay_out=layout([f])


curdoc().add_root(lay_out)
curdoc().add_periodic_callback(update,5000)

I don’t know how to help you with your particular example given that you have provided a working version and did not provide any errors/code from when you were trying to make it an OHLC chart.

Here’s a small example of a working OHLC chart with streaming:

from datetime import datetime
from random import random

from bokeh.io import curdoc
from bokeh.models import ColumnDataSource, CategoricalColorMapper
from bokeh.plotting import figure
from bokeh.transform import transform

inc_color = 'green'
dec_color = 'red'
ds = ColumnDataSource(dict(datetime=[], low=[], high=[], open=[], close=[], trend=[]))
color_transform = transform('trend',
                            CategoricalColorMapper(factors=['dec', 'inc'],
                                                   palette=['red', 'green']))

p = figure()
p.segment(x0='datetime', x1='datetime', y0='low', y1='high',
          color=color_transform, source=ds)
# Using a segment instead of a vbar to set the width in pixels instead of X scale units.
p.segment(x0='datetime', x1='datetime', y0='open', y1='close',
          width=10, color=color_transform, source=ds)


def update():
    o = random()
    c = random()
    ds.stream(dict(datetime=[datetime.now()], open=[o], close=[c],
                   low=[min(o, c) - random()], high=[min(o, c) + random()],
                   trend=['dec' if c < o else 'inc']),
              rollover=10)


curdoc().add_root(p)
curdoc().add_periodic_callback(update, 200)

Thank you, but I don’t drink. :slight_smile: If you want to express your gratitude, please consider donating directly to Bokeh at Donate to Bokeh or sponsoring it via GitHub.