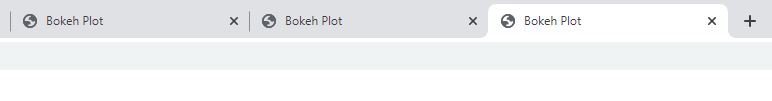
I am trying to change the title shown in the tab in chrome when spawning a bokeh graph into the browser with show(…) so that it does not have the default “Bokeh Plot”
What have you tried that did NOT work as expected?
Tried
show(p, title=“My new title”)
also tried
curdoc().add_root(p)
curdoc().title = “My new title”
I only see Bokeh Plot in the tab no matter what I try
Thanks for the version info @big_red_frog unfortunately what you linked is not a Minimal Reproducible Example. An MRE should be self-contained, and bereft of any extraneous code not directly related to the issue at hand. I would expect and MRE for thies to be in the low tens of lines, at most.
So let’s try another approach. When I run this example:
What happens when you run it? If you don’t get a tab with the expected title, then maybe this is some platform-specific issue, and so we would need detailed information about browser, OS, versions, etc. to have any hope of reproducing. If you do see the expected title, then you’ll need to greatly pare down you code to a self-contained, complete, minimal reproducible example so that we can easily look at the problem in isolation.
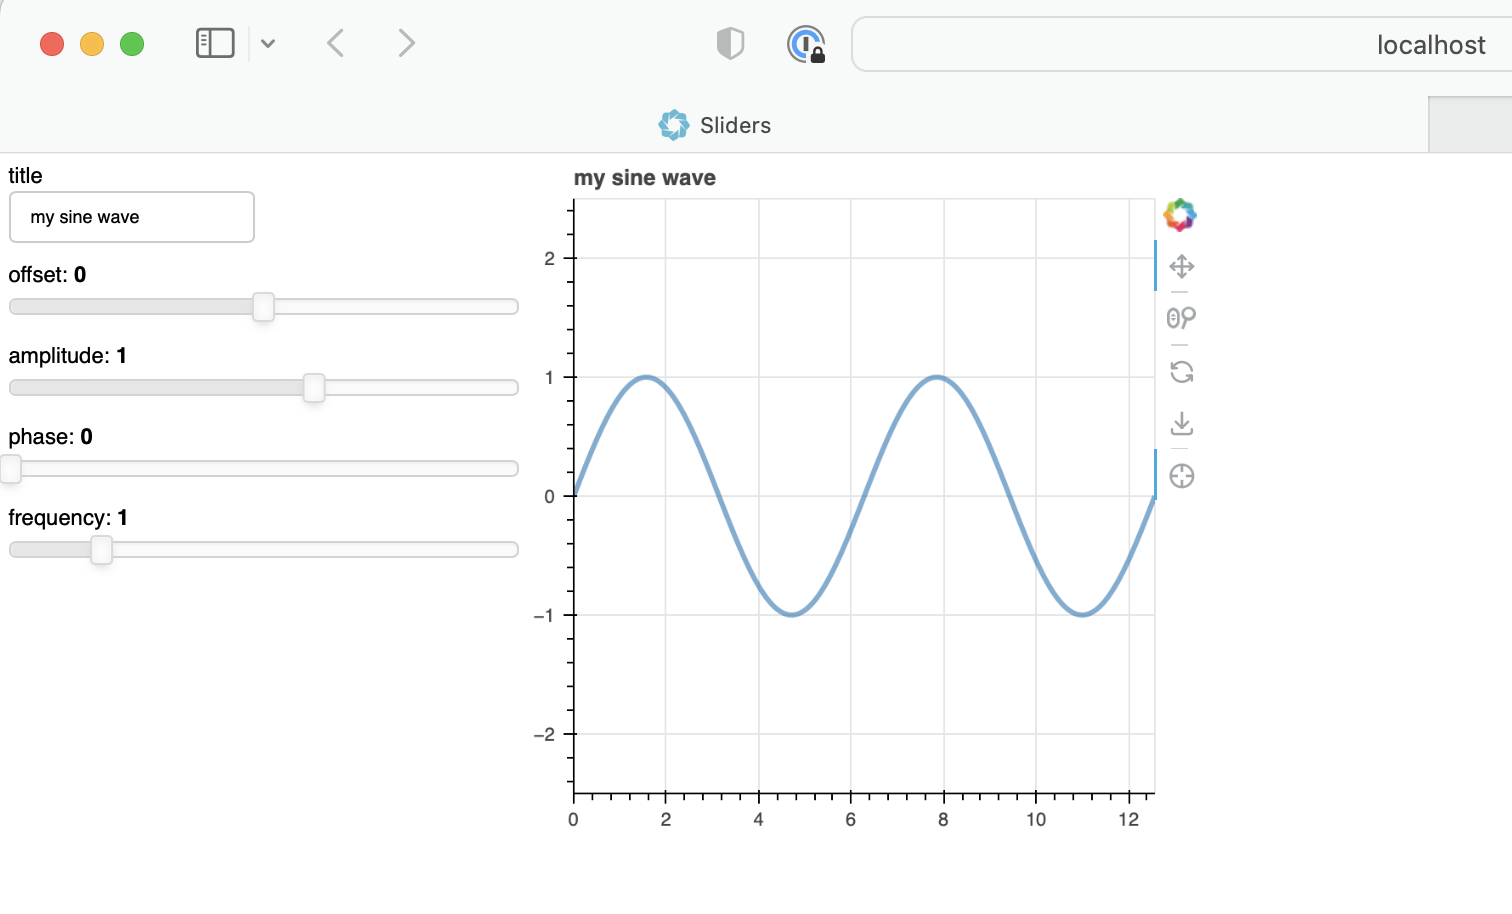
That seems to run fine, I see tab title of “slides” as expected.
Noting in my case I am running a show call from within an active python application, rather than Bokeh server. Let me see if I can hack that simple example for a show(…) implemention.
# Set up layouts and add to document
inputs = column(text, offset, amplitude, phase, freq)

curdoc().add_root(row(inputs, plot, width=800))
curdoc().title = "Sliders"

show(curdoc())
I get
Traceback (most recent call last):
  File "C:\Users\atod\PycharmProjects\bokeh1\main.py", line 77, in <module>
    show(curdoc())
  File "C:\Users\atod\PycharmProjects\bokeh1\amber\Lib\site-packages\bokeh\io\showing.py", line 154, in show
    raise ValueError(_BAD_SHOW_MSG)
ValueError: Invalid object to show. The object to passed to show must be one of:

* a UIElement (e.g. a plot, figure, widget or layout)
* a Bokeh Application
* a callable suitable to an application FunctionHandler
Actually scratch that, I was thinking of the BokehJS API. I think you are just running into some historical rough edges of Bokeh where original intended usage was a little different (because it was created way before the server existed). There seem to be a few ways to specify a title in the non-server case, but setting curdoc().title does not appear to be one so them. I think your options are:
call save (not show) since it accepts a title param
call output_file with the desired title before every call to show
My understanding is that both of those would force the creation of a file as well as the launched browser session. Is it possible to change the tab title without saving the html file, or is it required ( currently )
I am afraid I guess I don’t understand your situation or what you are trying to do. show also saves a file. There is no way to open a browser to show Bokeh HTML content without saving a corresponding file.
This (more or less) is all show does:
It’s always been that way and I would not expect it to change. If you don’t provide a filename, Bokeh will try to pick one based on the name of the current script. Perhaps that was confusing into thinking there was not a file being saved.
I am spawning a browser tab with all graphs required from runtime python code, so once displayed in the browser, I don’t expect to edit it further, but as I spawn a few seperate bokeh tabs, I want the user to be able to identify which tab is of interest via its title.
If bokeh save a file anyway, then I guess I should try manipulating the file title, I had not realised this.
However the following test code does not work either, sitll generating a tab of “Bokeh Plot”
import numpy as np

from bokeh.io import curdoc, output_file
from bokeh.models import ColumnDataSource
from bokeh.plotting import figure, show

# Set up data
N = 200
x = np.linspace(0, 4*np.pi, N)
y = np.sin(x)
source = ColumnDataSource(data=dict(x=x, y=y))

# Set up plot
plot = figure(height=400, width=400, title="my sine wave",
              tools="crosshair,pan,reset,save,wheel_zoom",
              x_range=[0, 4*np.pi], y_range=[-2.5, 2.5])

plot.line('x', 'y', source=source, line_width=3, line_alpha=0.6)

output_file(filename="slider.html")
show(plot)