Hi there,
I am having a problem with using Whiskers for error bars on my data points. I have a lot of data and I want users to be able to filter it. However the Whiskers are remaining when I am filtering my data and I cannot find any documentation about how to use filters (CDSView) or anything else to help remove them.
I would rather like to avoid rebuilding my ColumnDataSource every time a user filters the data.
This is an example:
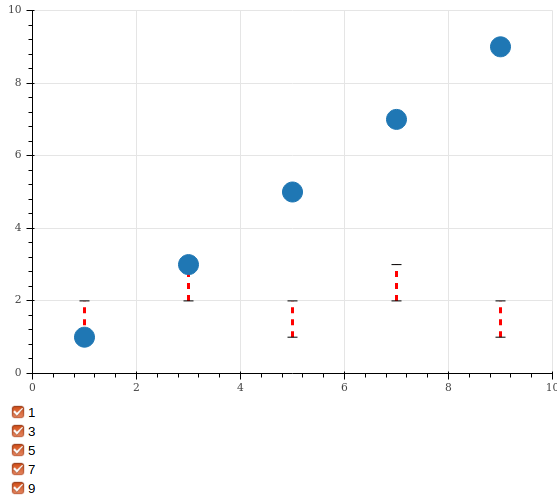
Assuming the dots are related to the whiskers in this example, if I uncheck a box a dot disappears.
I would like for both of the related whiskers to also disappear, I did have images for both of these steps but could not post them as I am a new user.
Here is the code for the demo:
from bokeh.layouts import layout
from bokeh.models import ColumnDataSource, OpenHead, Plot, Range1d, Whisker, CDSView, CheckboxGroup, CustomJS
from bokeh.models.filters import CustomJSFilter
from bokeh.plotting import figure, show

x_range = Range1d(0, 10)
y_range = Range1d(0, 10)

# Have to specify x/y range as labels aren't included in the plot area solver
plot = figure(plot_width=600, plot_height=600,
            x_range=x_range, y_range=y_range, toolbar_location=None)

# Data source
source = ColumnDataSource(data=dict(
    x1 = [1,3,5,7,9],
    lower1 = [1,2,1,2,1],
    upper1 = [2,3,2,3,2],
))

# Setup widget
labels= [str(x) for x in source.data.get('x1')]
checkbox_class = CheckboxGroup(
    labels=labels,
    active=list(range(len(labels))),
    sizing_mode="stretch_width"
)

# Widget callback arguments
arg_dict = dict (
    filter_source=source,
    classes = checkbox_class
)

# Create filter for all widgets
widget_filters = CustomJSFilter(args = arg_dict,
                                code =
"""
    let active_classes = classes.active.map(i=>classes.labels[i]);
    let class_column = filter_source.data.x1;
    let indices = [];

    // Check if there are filters that match the data
    for (let i=0; i<class_column.length; i++) {
        if(active_classes.includes(class_column[i].toString())){
            indices.push(i);
        }
    }
    return indices;
""")

# Watch for changes to user input fields
checkbox_class.js_on_change("active", CustomJS(code="source.change.emit();",
                                               args=dict(source=source)))

# Add Whisker to plot (No way to filter Whiskers)
plot.add_layout(Whisker(base='x1', lower='lower1', upper='upper1',
                   line_width=3, line_color='red', line_dash='dashed',
                   source=source))

# Add data points to plot (These are filterable)
plot.circle('x1', 'x1',
            size = 20,
            source = source,
            view = CDSView(source=source, filters=[widget_filters]))

bokeh_layout = layout([plot, checkbox_class],
                          sizing_mode='stretch_both')

show(bokeh_layout)