Help us help you! Writing your post to the following guidelines will help Bokeh Discourse reviewers understand your question, and increases the likelihood of a response.
What are you trying to do?
I am trying to take what I thought I learned and apply it to my own real world use cases.
What have you tried that did NOT work as expected? If you have also posted this question elsewhere (e.g. StackOverflow), please include a link to that post.
That would be too many to mention.
If this is a question about Bokeh code, please include a complete Minimal, Reproducible Example so that reviewers can test and see what you see.
# heatsimp7
def seven1():
from bokeh.plotting import figure, show
from datetime import datetime, timedelta
meds = ['Afinitor']
dates = [(datetime.now() + timedelta(day * 1)) for day in range(0, 7)]
week = ['sun', 'mon', 'tues', 'wed', 'thu', 'fri', 'sat']
compliance = ['nr', 'yes', 'no', 'nr', 'nr', 'yes', 'yes']
colors = [
"#0B486B", "#79BD9A", "#CFF09E",
"#79BD9A", "#0B486B", "#79BD9A",
"#CFF09E",
]
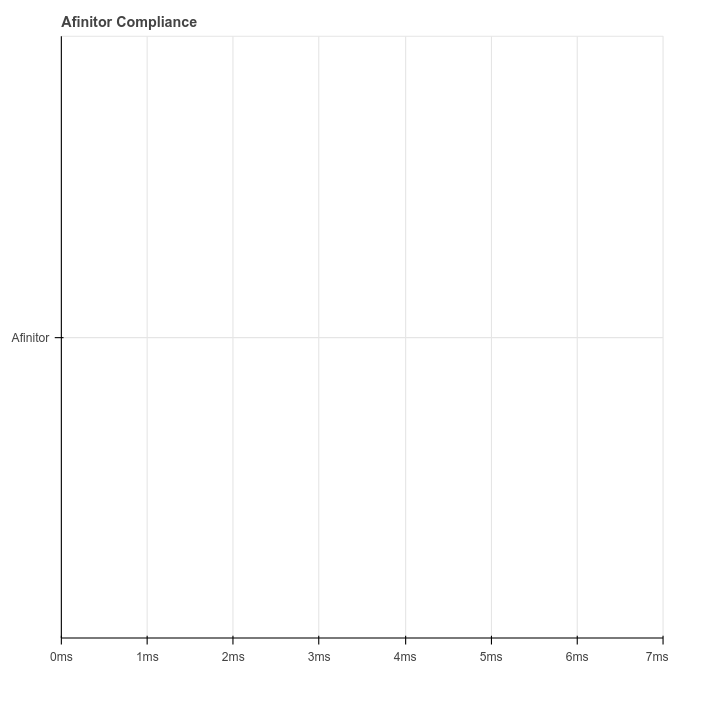
p = figure(title="Afinitor Compliance", tools="hover", toolbar_location=None,
x_range=week, y_range=meds, x_axis_type='datetime',)
p.rect(dates, compliance, color=colors, width=1, height=1)
# maybe compliance is an x, not a y?
show(p)
seven1()
In some cases, a screenshot of your plot will also be helpful.
-
x_range and y_range are both simple lists. y_range works as expected. x_range is giving me
milliseconds. My code says nothing about milliseconds. Is that some kind of default in x_axis_type=‘datetime’? -
I copied the dates variable verbatim from an earlier example in the first steps tutorial.
-
Neither the term ‘day’ nor the term ‘hour’ appear on this page about datetime properties:
bokeh.core.properties — Bokeh 2.4.2 Documentation
Neither of them are on the page about DatetimeAxis, either, but as a newby I can only post one link. -
There are no colors anywhere.
-
There are no values anywhere.
-
The hover is there, but there’s nothing to hover over.
-
I actually wanted a multi line graph, one line for each medication. But I made it simple after
running into these issues, which did not go away with my simplicity. -
Maybe I need a different tutorial? One that treats me like a 5th grader? Or even a
Kindergartner? Suggestions? Explanations?