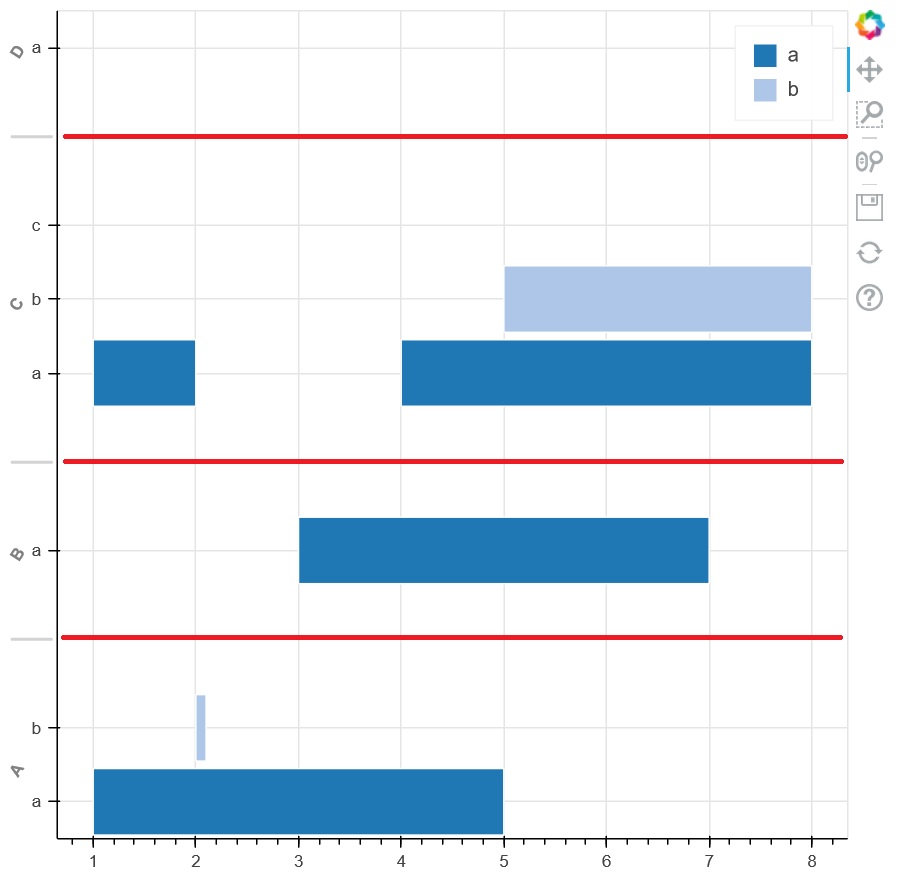
I think you can use Whisker annotation where you can use the dimension argument in order to have it horizontal. Also, the Whisker annotation supports source hence you just update the source when the data is updated.
In order to use the Whisker annotation you need to specify lowerand upper (in you case start and end of the x_range) that the separator should cover.
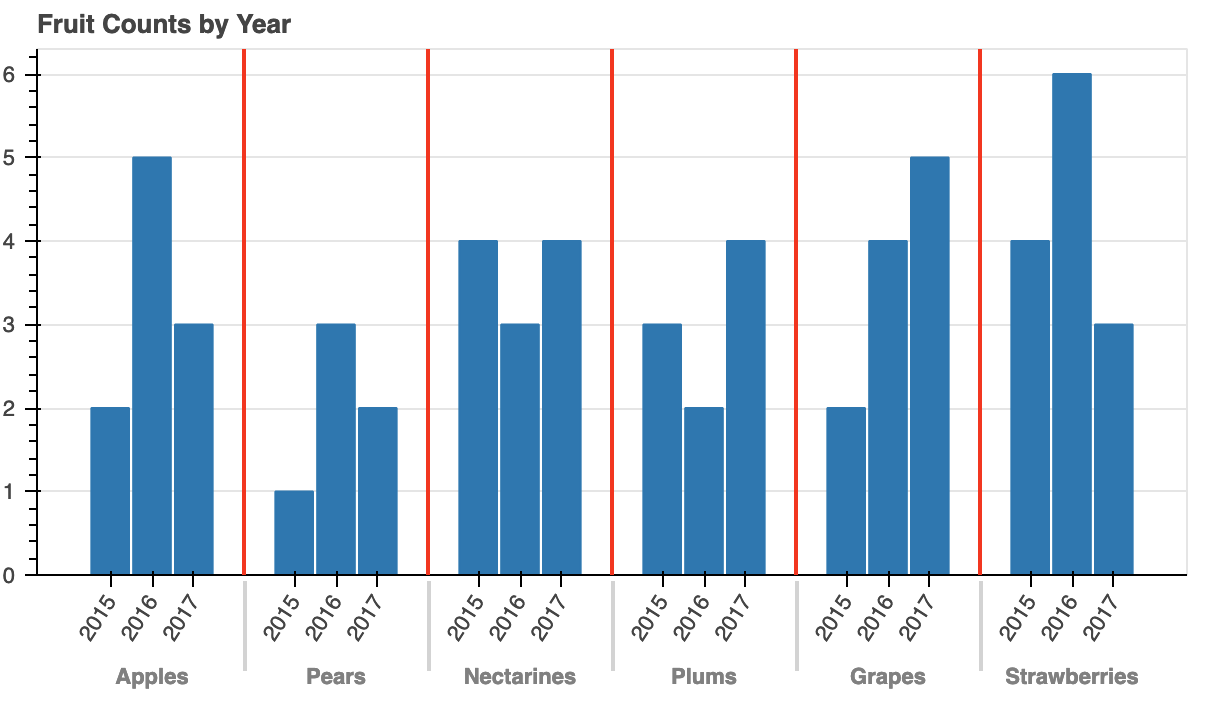
You also need to offset the Whisker in order to place it at the group separator. You can read about offset for factor_range in the documentation. I am using the range property group_padding in order to calculate the offset. For my example it gives the following
from bokeh.models import ColumnDataSource, FactorRange, Whisker
from bokeh.plotting import figure, save
from bokeh.transform import dodge

fruits = ['Apples', 'Pears', 'Nectarines', 'Plums', 'Grapes', 'Strawberries']
years = ['2015', '2016', '2017']

data = {
    'fruits': fruits,
    '2015': [2, 1, 4, 3, 2, 4],
    '2016': [5, 3, 3, 2, 4, 6],
    '2017': [3, 2, 4, 4, 5, 3]
    }

# this creates [ ("Apples", "2015"), ("Apples", "2016"), ("Apples", "2017"), ("Pears", "2015), ... ]
x = [ (fruit, year) for fruit in fruits for year in years ]
counts = sum(zip(data['2015'], data['2016'], data['2017']), ()) # like an hstack

source = ColumnDataSource(data=dict(x=x, counts=counts))

p = figure(x_range=FactorRange(*x), height=350, title="Fruit Counts by Year",
           toolbar_location=None, tools="")

p.vbar(x='x', top='counts', width=0.9, source=source)
p.y_range.start = 0
p.x_range.range_padding = 0.1
p.xaxis.major_label_orientation = 1
p.xgrid.grid_line_color = None

grp_pad = p.x_range.group_padding
sep_cat = [(f, y, 1+(grp_pad-1.0)/2.0) for (f, y) in x[0:-1] if y == '2017']

src_sep = ColumnDataSource(
    data = {
        "base": sep_cat,
        "lower": [0]*len(sep_cat),
        "upper": [max(counts)*1.05]*len(sep_cat)
    })
sep = Whisker(
    base="base", upper="upper", lower="lower", source=src_sep,
    level="annotation", line_width=2, line_color = "red",
    dimension = "height", upper_head=None, lower_head=None
    )

p.add_layout(sep)

save(p)