Figured it out from the v0.12.3 release notes.
import numpy as np
from scipy.cluster import hierarchy
from scipy.spatial import distance
from bokeh.plotting import figure, show, output_file
from bokeh.models import ColumnDataSource, FuncTickFormatter, FixedTicker
output_file(“test.html”)
data = np.random.rand(5, 300)
labels = list(“abcde”)
clusts = hierarchy.average(data)
dend = hierarchy.dendrogram(clusts, no_plot=True)
plot_ds = ColumnDataSource({“x”: dend[“icoord”],
“y”: dend[“dcoord”]})
axis_ds = ColumnDataSource({“label”: [labels[i] for i in dend[“leaves”]],
“position”: list( range(5, len(labels)*10+5, 10))})
p = figure(height=400, width=600)
p.multi_line(“x”, “y”, source=plot_ds)
p.xaxis.ticker = FixedTicker(ticks=axis_ds.data[“position”])
p.xaxis.formatter = FuncTickFormatter.from_coffeescript(
args=dict(axis_dsource=axis_ds),

code="""
axis_data = axis_dsource.get(“data”)
pos = axis_data[“position”]
idx = pos.indexOf(tick) if tick in pos
axis_data[“label”][idx]
""")
show(p)
···
On Thursday, October 13, 2016 at 2:01:25 PM UTC+11, [email protected] wrote:
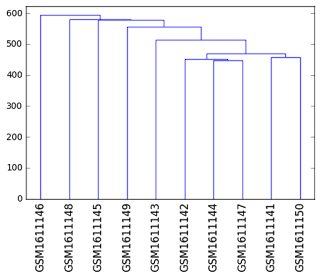
Is it possible to put text labels on a numerical axis? I’m trying to plot a dendogram (matplot lib example below), and would like the axis labels to be categorical, however I still need numerical x-coordinates for plotting. I’ve been considering adding a categorical axis, or trying the FuncTickFormatter, but have had trouble finding relevant examples.
Thanks for any help/ suggestions,
–Isaac
