Hello,
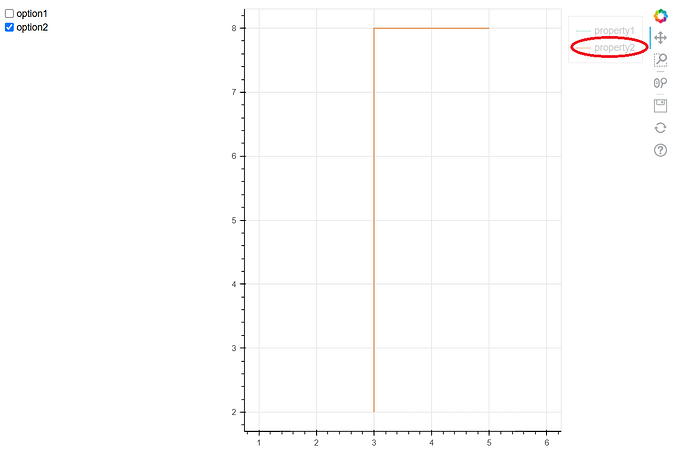
Is there a way to set opacity level of certain legend item from legend box? When toggling the visbility of graph plotted and fitlered by CDSView using MultiChoice widget, I notice the legend item is also toggled even though part of graph is still presented in diagram. As the picture below and code snippet, ‘property2’ data has both ‘option1’ and ‘option2’, though data graph filtered with option2 value is still presented in graph, the ‘property2’ in legend box is shown as ‘hidden’ while it’s still visible with the graph that has subset data ‘option2’
When checking LegendItem class, I found only ‘visible’ attribute which does not really tackle the issue of text opacity in legend box. I’m using bokeh version 2.4.3 but with latest version I also don’t find any change between the versions.
import pandas
import itertools
from bokeh.layouts import column, row
from bokeh.plotting import figure, show
from bokeh.plotting import figure, Figure
from bokeh.palettes import Dark2_7 as palette
from bokeh.models import (HoverTool, ColumnDataSource, Range1d, CheckboxGroup, CustomJS, CDSView,
                          GroupFilter)

data = {
    "property1": [
        {"x": 1, "y": 2, "option": "option1"},
        {"x": 2, "y": 4, "option": "option1"},
        {"x": 5, "y": 6, "option": "option1"},
    ],
    "property2": [
        {"x": 6, "y": 3, "option": "option1"},
        {"x": 3, "y": 2, "option": "option2"},
        {"x": 3, "y": 3, "option": "option1"},
        {"x": 5, "y": 8, "option": "option2"},
    ],
}

filter_data = {}

options = ["option1", "option2"]
fig = figure()
for item, color in zip(data.items(), itertools.cycle(palette)):
    property_name, records = item
    x = [item['x'] for item in records]
    y = [item['y'] for item in records]
    option_list = [item['option'] for item in records]
    df = pandas.DataFrame(list(zip(x, y, option_list)), columns=["x", "y", "option_list"])

    data_src = ColumnDataSource(df)
    views = [CDSView(source=data_src,
                        filters=[GroupFilter(column_name='option_list', group=label)]) \
                for label in options]
    filter_data[property_name] = []
    for view in views:
        scatter = fig.step(x="x", y="y", source=data_src,color = color, legend_label=property_name, name=property_name, view = view)
        filter_data[property_name].append(scatter)
options_checkbox = CheckboxGroup(labels=options,
                                active=list(range(len(options))))
# Checkbox callback to filter data based on selected paths
checkbox_callback = CustomJS(args=dict(filtered_view_renderers=filter_data),
                                 code="""
       const selected_options = cb_obj.active;
        for (let [property, renderers] of Object.entries(filtered_view_renderers)) {
            for(let i = 0, j=0; i < renderers.length; ++i){
                renderers[i].visible = (i == selected_options[j]);
                if(i == selected_options[j]) j++;
            }
        }
        """)

options_checkbox.js_on_change('active', checkbox_callback)
fig.legend.click_policy="hide"
fig.add_layout(fig.legend[0], 'right')
show(row(options_checkbox, fig))
