I am trying to adapt the Specialized Axis Ticking example but I do not understand where I can put the bold style. In models/formatters.py there is no code in the class CategoricalTickFormatter.
I would be very grateful if someone can point me out to the relevant code ??
All the axis label drawing happens in the Axis base class in the _draw_axis_label method (and all the actual work is another call deep in the _draw_oriented_label method). So you would need to make a custom extension Axis subclasss, not a custom extension tick formatter, and would need to override one or possibly both of those methods to do something different in your custom extension axis.
There’s not really a clean way to do this, I think you would have to just look at the labels right before they are drawn in the final loop, and do something different with the font settings (or not) based on your conditions. That’s not a good design, but at present the tick formatters only communicate string/text formatting, nothing else, so there is other place to override the normal font settings except right where the drawing happens.
Allowing tick formatters to also control font formatting, colors, etc. is definitely something that could be discussed and considered, but it will require a somewhat substantial overhaul of the current operation. Alternatively perhaps a new separate “tick font formatter” could be introduced that would be less disruptive (but also less convenient) Feel free to open a GitHub issue to discuss this feature request.
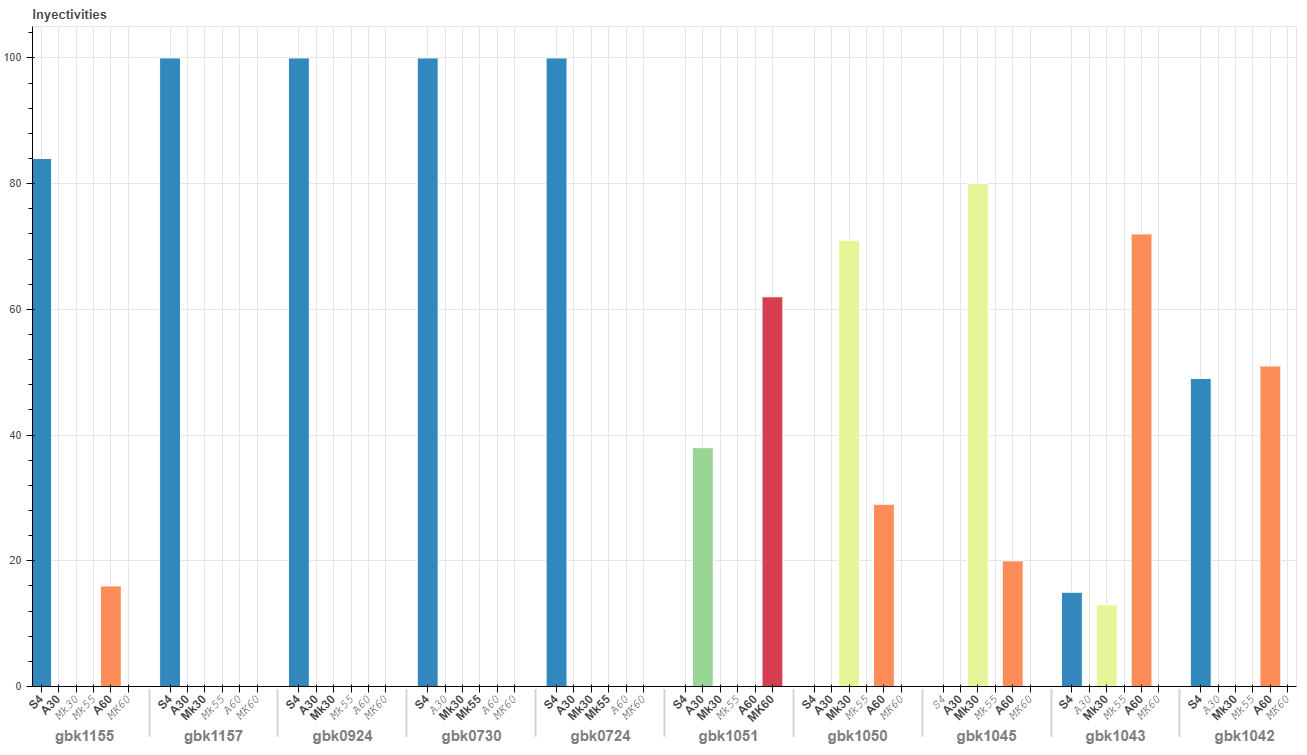
As you suggested, using a custom axis extension I could customize the style of the x axis label. I only had to override the _draw_oriented_labels method in the last section when ctx.fillText is used. The added funcionality is
let styles_list = (((Here is the list of styles  as shown in the full code of
                                  'bold 12px Arial',  'italic 9pt Courier' styles ))

  if (standoff < 30) // only the first stage labels
    {
        ctx.font = styles_list[i]
        console.log('entre en italic' +  styles_list[i])
    }
I still need to figure it out how to pass the list of string from python, but it will be in the weekend. I do not have to change the style of the labels so often.
Here is the complete code (I suppose it can be done subclassing the categoricalAxis class, but in the rush, it did not work to me ).
from bokeh.io import show
from bokeh.io import output_file, show
from bokeh.models import ColumnDataSource, FactorRange
from bokeh.plotting import figure
from bokeh.transform import factor_cmap
from bokeh.palettes import Spectral6
from bokeh.models import TickFormatter
from bokeh.models import ColumnDataSource, BoxAnnotation, Axis, FactorRange #, CategoricalAxis
from bokeh.models import CategoricalTickFormatter, CategoricalTicker
from bokeh.plotting import figure
from bokeh.util.compiler import TypeScript
from bokeh.core.properties import Override, Include, Either, Enum, Float
from bokeh.core.property_mixins import ScalarLineProps, ScalarTextProps
from bokeh.core.enums import TickLabelOrientation
TS_CODE = """
import {Axis, AxisView, Extents, TickCoords, Coords} from "models/axes/axis"
import {CategoricalTicker} from "models/tickers/categorical_ticker"
import {CategoricalTickFormatter} from "models/formatters/categorical_tick_formatter"
import {FactorRange, Factor, L1Factor, L2Factor, L3Factor} from "models/ranges/factor_range"
import * as visuals from "core/visuals"
import * as mixins from "core/property_mixins"
import * as p from "core/properties"
import {TickLabelOrientation} from "core/enums"
import {Context2d} from "core/util/canvas"
import {Orient} from "core/layout/side_panel"
import {isString} from "core/util/types"
import {Arrayable} from "core/types"
import {Side, SpatialUnits} from "core/enums"
export type MyTickCoords = TickCoords & {
mids: Coords
tops: Coords
}
export class MyAxisView extends AxisView {
model: MyAxis
visuals: MyAxis.Visuals
protected _paint(ctx: Context2d, extents: Extents, tick_coords: TickCoords): void {
this._draw_group_separators(ctx, extents, tick_coords)
}
protected _draw_group_separators(ctx: Context2d, _extents: Extents, _tick_coords: TickCoords): void {
const [range] = (this.ranges as any) as [FactorRange, FactorRange]
const [start, end] = this.computed_bounds
if (!range.tops || range.tops.length < 2 || !this.visuals.separator_line.doit)
return
const dim = this.dimension
const alt = (dim + 1) % 2
const coords: Coords = [[], []]
let ind = 0
for (let i = 0; i < range.tops.length - 1; i++) {
let first: Factor, last: Factor
for (let j = ind; j < range.factors.length; j++) {
if (range.factors[j][0] == range.tops[i+1]) {
[first, last] = [range.factors[j-1], range.factors[j]]
ind = j
break
}
}
const pt = (range.synthetic(first!) + range.synthetic(last!))/2
if (pt > start && pt < end) {
coords[dim].push(pt)
coords[alt].push(this.loc)
}
}
const tex = this._tick_label_extent()
this._draw_ticks(ctx, coords, -3, (tex-6), this.visuals.separator_line)
}
protected _draw_major_labels(ctx: Context2d, extents: Extents, _tick_coords: TickCoords): void {
const info = this._get_factor_info()
let standoff = extents.tick + this.model.major_label_standoff
for (let i = 0; i < info.length; i++) {
const [labels, coords, orient, visuals] = info[i]
console.log('viendo que label es'+ i)
this._draw_oriented_labels(ctx, labels, coords, orient, this.panel.side, standoff, visuals)
standoff += extents.tick_label[i]
console.log('viendo que label es'+ standoff)
}
}
protected _tick_label_extents(): number[] {
const info = this._get_factor_info()
const extents = []
for (const [labels,, orient, visuals] of info) {
const extent = this._oriented_labels_extent(labels, orient, this.panel.side, this.model.major_label_standoff, visuals)
extents.push(extent)
}
return extents
}
/////////////////////////////////////////////////////
///////////////////////////////////////////////////// /////////////////////////////////////////////////////
///////////////////////////////////////////////////// /////////////////////////////////////////////////////
/////////////////////////////////////////////////////
protected _draw_oriented_labels(ctx: Context2d, labels: string[], coords: Coords,
orient: Orient | number, _side: Side, standoff: number,
visuals: visuals.Text, units: SpatialUnits = "data"): void {
if (!visuals.doit || labels.length == 0)
return
let sxs, sys: Arrayable<number>
let xoff, yoff: number
if (units == "screen") {
[sxs, sys] = coords
;[xoff, yoff] = [0, 0]
} else {
const [dxs, dys] = coords
;[sxs, sys] = this.coordinates.map_to_screen(dxs, dys)
;[xoff, yoff] = this.offsets
}
const [nx, ny] = this.normals
const nxd = nx * (xoff + standoff)
const nyd = ny * (yoff + standoff)
visuals.set_value(ctx)
this.panel.apply_label_text_heuristics(ctx, orient)
let angle: number
if (isString(orient))
angle = this.panel.get_label_angle_heuristic(orient)
else
angle = -orient
for (let i = 0; i < sxs.length; i++) {
const sx = Math.round(sxs[i] + nxd)
const sy = Math.round(sys[i] + nyd)
// ctx.rotate(i*5)
let styles_list = ['bold 12px Arial', 'bold 12px Arial', 'italic 9pt Courier', 'italic 9pt Courier',
'bold 12px Arial', 'italic 9pt Courier', 'bold 12px Arial', 'bold 12px Arial', 'bold 12px Arial',
'italic 9pt Courier', 'italic 9pt Courier', 'italic 9pt Courier', 'bold 12px Arial', 'bold 12px Arial',
'bold 12px Arial', 'italic 9pt Courier', 'italic 9pt Courier', 'italic 9pt Courier', 'bold 12px Arial',
'italic 9pt Courier', 'bold 12px Arial', 'bold 12px Arial', 'italic 9pt Courier', 'italic 9pt Courier',
'bold 12px Arial', 'bold 12px Arial', 'bold 12px Arial', 'bold 12px Arial', 'italic 9pt Courier',
'italic 9pt Courier', 'bold 12px Arial', 'bold 12px Arial', 'bold 12px Arial', 'italic 9pt Courier',
'bold 12px Arial', 'bold 12px Arial', 'bold 12px Arial', 'bold 12px Arial', 'bold 12px Arial',
'italic 9pt Courier', 'bold 12px Arial', 'italic 9pt Courier', 'italic 9pt Courier', 'bold 12px Arial',
'bold 12px Arial', 'italic 9pt Courier', 'bold 12px Arial', 'italic 9pt Courier', 'bold 12px Arial',
'italic 9pt Courier', 'bold 12px Arial', 'italic 9pt Courier', 'bold 12px Arial', 'italic 9pt Courier',
'bold 12px Arial', 'italic 9pt Courier', 'bold 12px Arial', 'italic 9pt Courier', 'bold 12px Arial',
'italic 9pt Courier']
if (standoff < 30)
{
ctx.font = styles_list[i]
console.log('entre en italic' + styles_list[i])
}
ctx.translate(sx, sy)
ctx.rotate(angle)
ctx.fillText(labels[i], 0, 0)
ctx.rotate(-angle)
ctx.translate(-sx, -sy)
console.log(coords, 'greattt' + i + labels[i])
//ctx.fillStyle = color2css('blue', 0.5)
}
}
/////////////////////////////////////////////////////
///////////////////////////////////////////////////// /////////////////////////////////////////////////////
///////////////////////////////////////////////////// /////////////////////////////////////////////////////
/////////////////////////////////////////////////////
protected _get_factor_info(): [string[], Coords, Orient | number, visuals.Text][] {
const [range] = (this.ranges as any) as [FactorRange, FactorRange]
const [start, end] = this.computed_bounds
const loc = this.loc
const ticks = this.model.ticker.get_ticks(start, end, range, loc, {})
const coords = this.tick_coords
const info: [string[], Coords, Orient | number, visuals.Text][] = []
if (range.levels == 1) {
const major = ticks.major as L1Factor[]
const labels = this.model.formatter.doFormat(major, this)
info.push([labels, coords.major, this.model.major_label_orientation, this.visuals.major_label_text])
} else if (range.levels == 2) {
const major = (ticks.major as L2Factor[]).map((x) => x[1])
const labels = this.model.formatter.doFormat(major, this)
info.push([labels, coords.major, this.model.major_label_orientation, this.visuals.major_label_text])
info.push([ticks.tops as string[], coords.tops, this.model.group_label_orientation, this.visuals.group_text])
} else if (range.levels == 3) {
const major = (ticks.major as L3Factor[]).map((x) => x[2])
const labels = this.model.formatter.doFormat(major, this)
const mid_labels = ticks.mids.map((x) => x[1])
info.push([labels, coords.major, this.model.major_label_orientation, this.visuals.major_label_text])
info.push([mid_labels as string[], coords.mids, this.model.subgroup_label_orientation, this.visuals.subgroup_text])
info.push([ticks.tops as string[], coords.tops, this.model.group_label_orientation, this.visuals.group_text])
}
return info
}
// {{{ TODO: state // esto es para las coordenadas
get tick_coords(): MyTickCoords {
const i = this.dimension
const j = (i + 1) % 2
const [range] = (this.ranges as any) as [FactorRange, FactorRange]
const [start, end] = this.computed_bounds
const ticks = this.model.ticker.get_ticks(start, end, range, this.loc, {})
const coords: MyTickCoords = {
major: [[], []],
mids: [[], []],
tops: [[], []],
minor: [[], []],
}
coords.major[i] = ticks.major as any
coords.major[j] = ticks.major.map((_x) => this.loc)
if (range.levels == 3) {
coords.mids[i] = ticks.mids as any
coords.mids[j] = ticks.mids.map((_x) => this.loc)
}
if (range.levels > 1) {
coords.tops[i] = ticks.tops as any
coords.tops[j] = ticks.tops.map((_x) => this.loc)
}
return coords
}
// }}}
}
export namespace MyAxis {
export type Attrs = p.AttrsOf<Props>
export type Props = Axis.Props & {
ticker: p.Property<CategoricalTicker>
formatter: p.Property<CategoricalTickFormatter>
group_label_orientation: p.Property<TickLabelOrientation | number>
subgroup_label_orientation: p.Property<TickLabelOrientation | number>
} & Mixins
export type Mixins =
mixins.SeparatorLine &
mixins.GroupText &
mixins.SubGroupText
export type Visuals = Axis.Visuals & {
separator_line: visuals.Line
group_text: visuals.Text
subgroup_text: visuals.Text
}
}
export interface MyAxis extends MyAxis.Attrs {}
export class MyAxis extends Axis {
properties: MyAxis.Props
__view_type__: MyAxisView
ticker: CategoricalTicker
formatter: CategoricalTickFormatter
constructor(attrs?: Partial<MyAxis.Attrs>) {
super(attrs)
}
static init_MyAxis(): void {
this.prototype.default_view = MyAxisView
this.mixins<MyAxis.Mixins>([
["separator_", mixins.Line],
["group_", mixins.Text],
["subgroup_", mixins.Text],
])
this.define<MyAxis.Props>({
group_label_orientation: [ p.Any, "parallel" ], // TODO: p.TickLabelOrientation | p.Number
subgroup_label_orientation: [ p.Any, "parallel" ], // TODO: p.TickLabelOrientation | p.Number
})
this.override({
ticker: () => new CategoricalTicker(),
formatter: () => new CategoricalTickFormatter(),
separator_line_color: "lightgrey",
separator_line_width: 2,
group_text_font_style: "bold",
group_text_font_size: "15px",
group_text_color: "grey",
subgroup_text_font_style: "bold",
subgroup_text_font_size: "15px",
})
}
}
"""
class MyAxis(Axis):
''' An axis that displays ticks and labels for categorical ranges.
The ``CategoricalAxis`` can handle factor ranges with up to two levels of
nesting, including drawing a separator line between top-level groups of
factors.
'''
ticker = Override(default=lambda: CategoricalTicker())
formatter = Override(default=lambda: CategoricalTickFormatter())
separator_props = Include(ScalarLineProps, help="""
The %s of the separator line between top-level categorical groups.
This property always applies to factors in the outermost level of nesting.
""")
separator_line_color = Override(default="lightgrey")
separator_line_width = Override(default=2)
group_props = Include(ScalarTextProps, help="""
The %s of the group categorical labels.
This property always applies to factors in the outermost level of nesting.
If the list of categorical factors is flat (i.e. no nesting) then this
property has no effect.
""")
group_label_orientation = Either(Enum(TickLabelOrientation), Float, default="parallel", help="""
What direction the group label text should be oriented.
If a number is supplied, the angle of the text is measured from horizontal.
This property always applies to factors in the outermost level of nesting.
If the list of categorical factors is flat (i.e. no nesting) then this
property has no effect.
""")
group_text_font_size = Override(default="11px")
group_text_font_style = Override(default="bold")
group_text_color = Override(default="grey")
subgroup_props = Include(ScalarTextProps, help="""
The %s of the subgroup categorical labels.
This property always applies to factors in the middle level of nesting.
If the list of categorical factors is has only zero or one levels of nesting,
then this property has no effect.
""")
subgroup_label_orientation = Either(Enum(TickLabelOrientation), Float, default="parallel", help="""
What direction the subgroup label text should be oriented.
If a number is supplied, the angle of the text is measured from horizontal.
This property always applies to factors in the middle level of nesting.
If the list of categorical factors is has only zero or one levels of nesting,
then this property has no effect.
""")
subgroup_text_font_size = Override(default="11px")
subgroup_text_font_style = Override(default="bold")
__implementation__ = TypeScript(TS_CODE)
# x = ['label1','label2','label3','label4','label5','label6','label7', 'label8']
y = [1.0, 2.7, 1.2, 4.5, 1.5, 2.2, 1.8, 4.6]
# p = figure(x_range=[*x], y_range=(0, 5), plot_height=400, plot_width=1850)
# dots = p.circle(x=x, y=y, color='black',size=10)
# line = p.line(x=x, y=y, color='black')
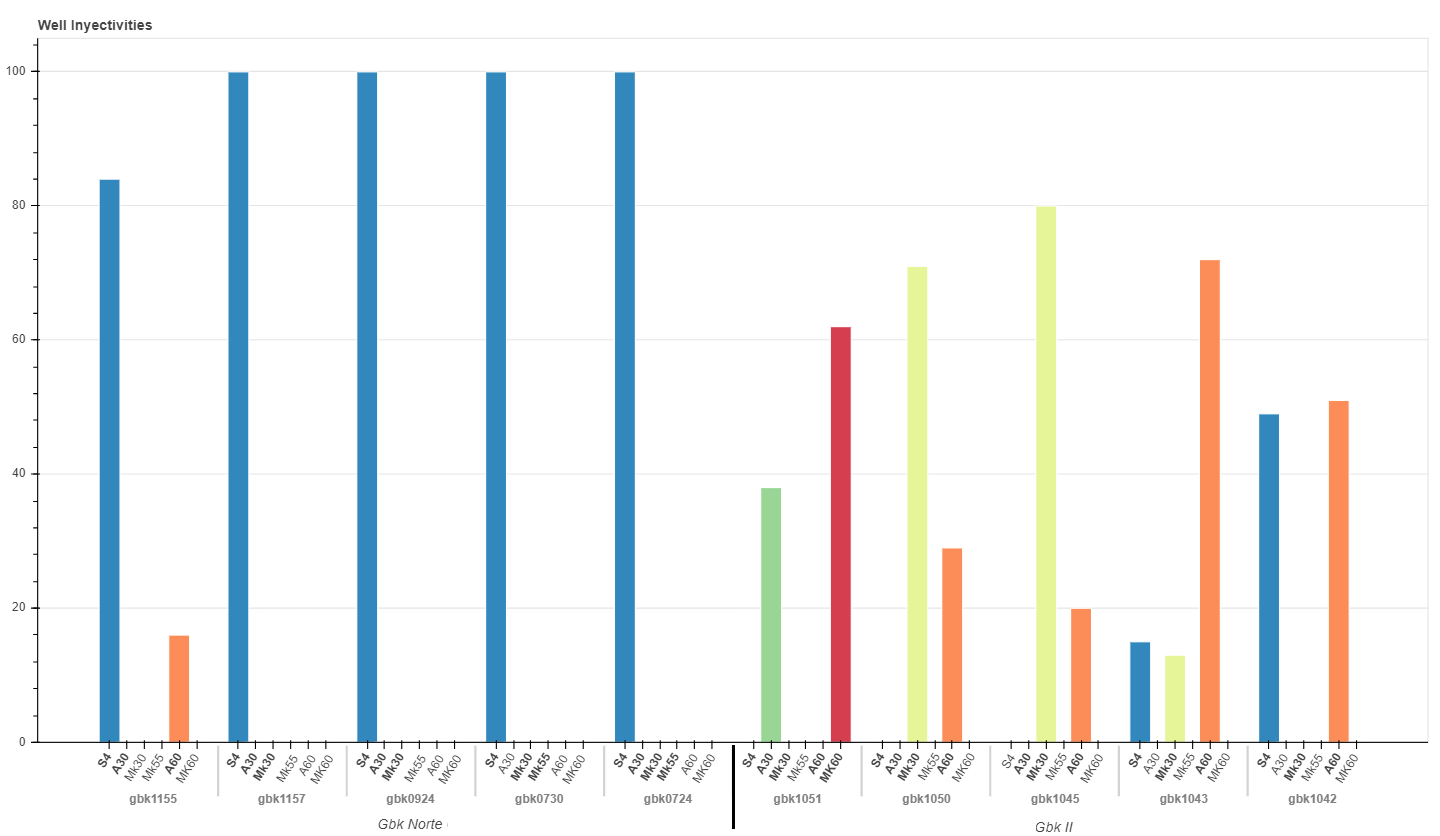
wells = ['gbk1155','gbk1157','gbk0924','gbk0730','gbk0724',
'gbk1051','gbk1050','gbk1045','gbk1043','gbk1042']
etapas = ['S4', 'A30', 'Mk30', 'Mk55','A60','MK60']
data = {'wells' : wells,
'S4' : [84, 100, 100, 100, 100,
0 , 0 , 0, 15, 49],
'A30' : [0, 0, 0, 0, 0,
38 , 0, 0, 0, 0],
'Mk30' : [0, 0, 0, 0, 0,
0 , 71, 80, 13, 0],
'Mk55' : [0, 0, 0, 0, 0,
0 , 0, 0, 0, 0],
'A60' : [16, 0, 0, 0, 0,
0 , 29, 20, 72, 51],
'Mk60' : [0, 0, 0, 0, 0,
62 , 0, 0, 0, 0]}
# this creates [ ("Apples", "2015"), ("Apples", "2016"), ("Apples", "2017"), ("Pears", "2015), ... ]
x = [ (well, etapa) for well in wells for etapa in etapas ]
counts = sum(zip(data['S4'], data['A30'], data['Mk30'], data['Mk55'], data['A60'], data['Mk60']), ()) # like an hstack
source = ColumnDataSource(data=dict(x=x, counts=counts))
# 750 1300
p = figure(x_range=FactorRange(*x), y_range=(0, 105), plot_height=750, plot_width= 1300, title="Inyectivities",
toolbar_location=None, tools="")
p.vbar(x='x', top='counts', width=1.2, source=source, line_color="white",
fill_color=factor_cmap('x', palette=Spectral6, factors=etapas, start=1, end=2))
numbers = [str(x) for x in y]
wells = ['gbk1155','gbk1157','gbk0924','gbk0730','gbk0724',
'gbk1051','gbk1050','gbk1045','gbk1043','gbk1042']
etapas = ['S4', 'A30', 'Mk30', 'Mk55','A60','MK60']
data = {'wells' : wells,
'S4' : [84, 100, 100, 100, 100,
0 , 0 , 0, 15, 49],
'A30' : [0, 0, 0, 0, 0,
38 , 0, 0, 0, 0],
'Mk30' : [0, 0, 0, 0, 0,
0 , 71, 80, 13, 0],
'Mk55' : [0, 0, 0, 0, 0,
0 , 0, 0, 0, 0],
'A60' : [16, 0, 0, 0, 0,
0 , 29, 20, 72, 51],
'Mk60' : [0, 0, 0, 0, 0,
62 , 0, 0, 0, 0]}
# this creates [ ("Apples", "2015"), ("Apples", "2016"), ("Apples", "2017"), ("Pears", "2015), ... ]
numbers = [ (well, etapa) for well in wells for etapa in etapas ]
p.extra_x_ranges = {"extra_numbers": FactorRange(factors=numbers)}
p.xaxis.visible = False
p.add_layout(MyAxis(x_range_name="extra_numbers"), 'below')
p.xaxis.major_label_orientation = 0.8
# p.xaxis.separator_props = 't'
show(p)