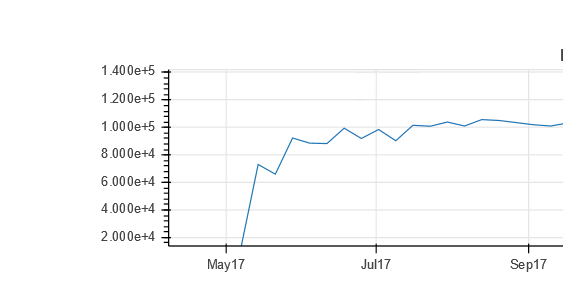
I have created a bokeh plot. Attached is the image of plot. Y axis of bokeh plot is showing labels in the power of ten. How can I change them to show in decimal values like 20000,40000,60000,80000,100000 and so on. I have also asked the question on https://stackoverflow.com/questions/50227974/changing-ticker-label-of-axis-in-bokeh.
Hi,
Please provide the source code for this example.
If you use Pandas this should work:
pd.options.display.float_format = ‘{:f}’.format
BR,
Maria
···
2018-05-08 9:41 GMT+02:00 2014BIT046 AVINASH NARAYAN MAGAR [email protected]:
I have created a bokeh plot. Attached is the image of plot. Y axis of bokeh plot is showing labels in the power of ten. How can I change them to show in decimal values like 20000,40000,60000,80000,100000 and so on. I have also asked the question on https://stackoverflow.com/questions/50227974/changing-ticker-label-of-axis-in-bokeh.
–
You received this message because you are subscribed to the Google Groups “Bokeh Discussion - Public” group.
To unsubscribe from this group and stop receiving emails from it, send an email to [email protected].
To post to this group, send email to [email protected].
To view this discussion on the web visit https://groups.google.com/a/continuum.io/d/msgid/bokeh/21d14ad1-f7d7-4cd9-aa16-601d56604fa6%40continuum.io.
For more options, visit https://groups.google.com/a/continuum.io/d/optout.