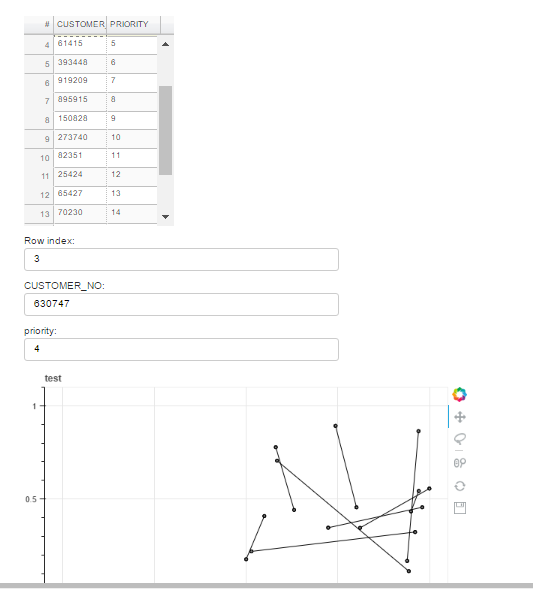
I am trying to change a NetworkX sub graph by clicking a value in bokeh data table. This clicked value should form the subgraph node value. I can see and visualize the required value in the layout boxes but the same value is not getting used to display the related NetworkX sub Graph. There is no error message obtained. The output shows a correct bokeh data table, the clicks on the customer number shows me correct values in layout boxs I am getting the node and edges of all subgraphs in the plot window . The click should show me only the subgraph of the associated node value that is clicked in the data Table.
I have tried using python call back, but its not working either.It says “Only JavaScript callbacks may be used with standalone output”.
The code used is below:–
#from bokeh.io import vplot
from bokeh.plotting import figure
from bokeh.models.graphs import from_networkx,NodesAndLinkedEdges,EdgesAndLinkedNodes
from bokeh.plotting import figure
from bokeh.models import Plot,Range1d
from bokeh.io import output_file, show
from datetime import date
from random import randint
from bokeh.models import ColumnDataSource
from bokeh.models.widgets import DataTable, DateFormatter, TableColumn
import bokeh.layouts as layouts
import bokeh.models.widgets as widgets
from bokeh.io import curdoc
source= ColumnDataSource(dict(CUSTOMER_NO = pr, priority = np.arange(1,len(pr)+1,1)))
columns = [TableColumn(field = “CUSTOMER_NO”, title = “CUSTOMER_NO”), TableColumn(field = “priority”, title = “PRIORITY”)]
data_table = DataTable(source = source, columns = columns, width = 200, height = 280, editable = True, reorderable = False)
text_row = TextInput(value = None, title = “Row index:”, width = 420)
text_CUSTOMER_NO = TextInput(value =None, title = “CUSTOMER_NO:”, width = 420)
text_priority = TextInput(value = None, title = “priority:”, width = 420)
source_code = “”"
row = cb_obj.indices[0]
text_row.value = String(row);
text_CUSTOMER_NO.value = String(source.data[‘CUSTOMER_NO’][row])
text_priority.value = String(source.data[‘priority’][row]);"""
callback = CustomJS(args = dict(source = source, text_row = text_row,text_CUSTOMER_NO=text_CUSTOMER_NO,text_priority=text_priority), code = source_code)
#callback = CustomJS(args = dict(source = source, text_CUSTOMER_NO=text_CUSTOMER_NO), code = source_code)
plot = figure(title=‘test’,x_range=Range1d(-1.1,1.1),y_range=Range1d(-1.1,1.1), tools = [‘reset’, ‘pan’,‘wheel_zoom’,‘save’, ‘lasso_select’, ])
plot.renderers.clear()
T=source.selected.js_on_change(‘indices’, callback)
s = G.subgraph(nx.shortest_path(G.to_undirected(),))
pos=nx.random_layout(s)
graph=from_networkx(s,pos)
plot.renderers.append(graph)
layout = column(data_table, text_row,text_CUSTOMER_NO,text_priority,plot)
bokeh.io.output_notebook()
bokeh.io.show(layout)
#bokeh.io.show(plot)