Hi, iam trying to change a graph when a button is clicked.
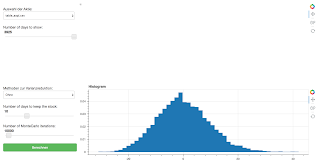
this is what the two charts should look like
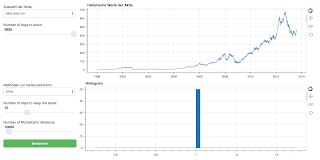
But when i try to change the lower graph, the upper one just disappears
This is the code i use to generate the layout:
curdoc().add_root(desc)
# set up layout
c1 = column(stock, days)
c2 = column(ts1)
r1 = row(c1, c2)
curdoc().add_root(r1)

cCalc = column(select_varianzred, daysToKeepTheStock, iterations, button)
c2Calc = column(hg1)
r2 = row(cCalc, c2Calc)
curdoc().add_root(r2)
(having just one add_root doesnt change the outcome)
and this is the code is use to replace the graph:
hg_ = figure(title="Histogram", id='histog', plot_width=900, plot_height=300, tools=tools)
hist_, edges_ = np.histogram(mc_returns, density=True, bins=50)
hg_.quad(top=hist_, bottom=0, left=edges_[:-1], right=edges_[1:])

r2.children[1] =hg_
iam thankful for any input
bokeh version 12.4
Hello,
I am using bokeh 12.5 and I am facing the same bug. did you found a workaround ?
···
On Sunday, January 22, 2017 at 12:55:58 AM UTC+1, Lukas Girsch wrote:
Hi, iam trying to change a graph when a button is clicked.
this is what the two charts should look like
But when i try to change the lower graph, the upper one just disappears
This is the code i use to generate the layout:
curdoc().add_root(desc)
# set up layout
c1 = column(stock, days)
c2 = column(ts1)
r1 = row(c1, c2)
curdoc().add_root(r1)

cCalc = column(select_varianzred, daysToKeepTheStock, iterations, button)
c2Calc = column(hg1)
r2 = row(cCalc, c2Calc)
curdoc().add_root(r2)
(having just one add_root doesnt change the outcome)
and this is the code is use to replace the graph:
hg_ = figure(title="Histogram", id='histog', plot_width=900, plot_height=300, tools=tools)
hist_, edges_ = np.histogram(mc_returns, density=True, bins=50)
hg_.quad(top=hist_, bottom=0, left=edges_[:-1], right=edges_[1:])

r2.children[1] =hg_
iam thankful for any input
bokeh version 12.4
Hey,
The issue in Lukas’ example appears to be caused by adding multiple roots to the current document to create a “layout”. I can’t say if displaying multiple roots is an intended feature of Bokeh, but it seems counter intuitive and does break the figures in previously added roots. So, I would suggest avoiding this pattern. In Lukas’ example, this would be one way of combining the rows into a single layout:
layout = column(r1, r2)
curdoc().add_root(layout)
If you are running into a different issue, sharing a small reproducible example will make it easier for others to help.
Regards,
Tyler
···
On Thursday, April 13, 2017 at 4:23:21 AM UTC-7, akasolace wrote:
Hello,
I am using bokeh 12.5 and I am facing the same bug. did you found a workaround ?
On Sunday, January 22, 2017 at 12:55:58 AM UTC+1, Lukas Girsch wrote:
Hi, iam trying to change a graph when a button is clicked.
this is what the two charts should look like
But when i try to change the lower graph, the upper one just disappears
This is the code i use to generate the layout:
curdoc().add_root(desc)
# set up layout
c1 = column(stock, days)
c2 = column(ts1)
r1 = row(c1, c2)
curdoc().add_root(r1)

cCalc = column(select_varianzred, daysToKeepTheStock, iterations, button)
c2Calc = column(hg1)
r2 = row(cCalc, c2Calc)
curdoc().add_root(r2)
(having just one add_root doesnt change the outcome)
and this is the code is use to replace the graph:
hg_ = figure(title="Histogram", id='histog', plot_width=900, plot_height=300, tools=tools)
hist_, edges_ = np.histogram(mc_returns, density=True, bins=50)
hg_.quad(top=hist_, bottom=0, left=edges_[:-1], right=edges_[1:])

r2.children[1] =hg_
iam thankful for any input
bokeh version 12.4
Hello, sorry for the late answer but I am just back from holiday
On my side I have a single root
curdoc().add_root(rows)
``
Then I have a widget on_change method that does something like:
def update(attr, old, new):
p = Bar(…)
rows[0][0] = p
``
the updated graph is displayed along with the first column of the layout but the second column of the layout becomes blank
···
On Friday, April 14, 2017 at 3:49:05 AM UTC+2, Tyler Nickerson wrote:
Hey,
The issue in Lukas’ example appears to be caused by adding multiple roots to the current document to create a “layout”. I can’t say if displaying multiple roots is an intended feature of Bokeh, but it seems counter intuitive and does break the figures in previously added roots. So, I would suggest avoiding this pattern. In Lukas’ example, this would be one way of combining the rows into a single layout:
layout = column(r1, r2)
curdoc().add_root(layout)
If you are running into a different issue, sharing a small reproducible example will make it easier for others to help.
Regards,
Tyler
On Thursday, April 13, 2017 at 4:23:21 AM UTC-7, akasolace wrote:
Hello,
I am using bokeh 12.5 and I am facing the same bug. did you found a workaround ?
On Sunday, January 22, 2017 at 12:55:58 AM UTC+1, Lukas Girsch wrote:
Hi, iam trying to change a graph when a button is clicked.
this is what the two charts should look like
But when i try to change the lower graph, the upper one just disappears
This is the code i use to generate the layout:
curdoc().add_root(desc)
# set up layout
c1 = column(stock, days)
c2 = column(ts1)
r1 = row(c1, c2)
curdoc().add_root(r1)

cCalc = column(select_varianzred, daysToKeepTheStock, iterations, button)
c2Calc = column(hg1)
r2 = row(cCalc, c2Calc)
curdoc().add_root(r2)
(having just one add_root doesnt change the outcome)
and this is the code is use to replace the graph:
hg_ = figure(title="Histogram", id='histog', plot_width=900, plot_height=300, tools=tools)
hist_, edges_ = np.histogram(mc_returns, density=True, bins=50)
hg_.quad(top=hist_, bottom=0, left=edges_[:-1], right=edges_[1:])

r2.children[1] =hg_
iam thankful for any input
bokeh version 12.4
No worries. Nothing looks wrong from the code snippets you’ve provided. It looks like rows is a nested layout though. What does your full layout look like? And is there any chance that you’ve replaced a layout object containing two plots with a single plot in the line rows[0][0] = p?
If you are able to provide a reproducible example of the issue, it will make tracking down the source of the issue easier.
Regards,
Tyler
···
On Wed, Apr 19, 2017 at 5:26 AM, akasolace [email protected] wrote:
Hello, sorry for the late answer but I am just back from holiday
On my side I have a single root
curdoc().add_root(rows)
``
Then I have a widget on_change method that does something like:
def update(attr, old, new):
p = Bar(…)
rows[0][0] = p
``
the updated graph is displayed along with the first column of the layout but the second column of the layout becomes blank
On Friday, April 14, 2017 at 3:49:05 AM UTC+2, Tyler Nickerson wrote:
Hey,
The issue in Lukas’ example appears to be caused by adding multiple roots to the current document to create a “layout”. I can’t say if displaying multiple roots is an intended feature of Bokeh, but it seems counter intuitive and does break the figures in previously added roots. So, I would suggest avoiding this pattern. In Lukas’ example, this would be one way of combining the rows into a single layout:
layout = column(r1, r2)
curdoc().add_root(layout)
If you are running into a different issue, sharing a small reproducible example will make it easier for others to help.
Regards,
Tyler
On Thursday, April 13, 2017 at 4:23:21 AM UTC-7, akasolace wrote:
Hello,
I am using bokeh 12.5 and I am facing the same bug. did you found a workaround ?
On Sunday, January 22, 2017 at 12:55:58 AM UTC+1, Lukas Girsch wrote:
Hi, iam trying to change a graph when a button is clicked.
this is what the two charts should look like
But when i try to change the lower graph, the upper one just disappears
This is the code i use to generate the layout:
curdoc().add_root(desc)
# set up layout
c1 = column(stock, days)
c2 = column(ts1)
r1 = row(c1, c2)
curdoc().add_root(r1)

cCalc = column(select_varianzred, daysToKeepTheStock, iterations, button)
c2Calc = column(hg1)
r2 = row(cCalc, c2Calc)
curdoc().add_root(r2)
(having just one add_root doesnt change the outcome)
and this is the code is use to replace the graph:
hg_ = figure(title="Histogram", id='histog', plot_width=900, plot_height=300, tools=tools)
hist_, edges_ = np.histogram(mc_returns, density=True, bins=50)
hg_.quad(top=hist_, bottom=0, left=edges_[:-1], right=edges_[1:])

r2.children[1] =hg_
iam thankful for any input
bokeh version 12.4
–
You received this message because you are subscribed to the Google Groups “Bokeh Discussion - Public” group.
To unsubscribe from this group and stop receiving emails from it, send an email to [email protected].
To post to this group, send email to [email protected].
To view this discussion on the web visit https://groups.google.com/a/continuum.io/d/msgid/bokeh/757f2d4e-95c2-4cdb-82cb-95ab31d73816%40continuum.io.
For more options, visit https://groups.google.com/a/continuum.io/d/optout.
Hello Tyler,
It is indeed a nested layout, and I am correctly replacing a plot by another plot.
I
will provide you with a working example (but I will need to find some time to clean up the existing code into something I can share with you)
BR
···
On Wednesday, April 19, 2017 at 5:46:21 PM UTC+2, Tyler Nickerson wrote:
No worries. Nothing looks wrong from the code snippets you’ve provided. It looks like rows is a nested layout though. What does your full layout look like? And is there any chance that you’ve replaced a layout object containing two plots with a single plot in the line rows[0][0] = p?
If you are able to provide a reproducible example of the issue, it will make tracking down the source of the issue easier.
Regards,
Tyler
On Wed, Apr 19, 2017 at 5:26 AM, akasolace [email protected] wrote:
Hello, sorry for the late answer but I am just back from holiday
On my side I have a single root
curdoc().add_root(rows)
``
Then I have a widget on_change method that does something like:
def update(attr, old, new):
p = Bar(…)
rows[0][0] = p
``
the updated graph is displayed along with the first column of the layout but the second column of the layout becomes blank
On Friday, April 14, 2017 at 3:49:05 AM UTC+2, Tyler Nickerson wrote:
Hey,
The issue in Lukas’ example appears to be caused by adding multiple roots to the current document to create a “layout”. I can’t say if displaying multiple roots is an intended feature of Bokeh, but it seems counter intuitive and does break the figures in previously added roots. So, I would suggest avoiding this pattern. In Lukas’ example, this would be one way of combining the rows into a single layout:
layout = column(r1, r2)
curdoc().add_root(layout)
If you are running into a different issue, sharing a small reproducible example will make it easier for others to help.
Regards,
Tyler
On Thursday, April 13, 2017 at 4:23:21 AM UTC-7, akasolace wrote:
Hello,
I am using bokeh 12.5 and I am facing the same bug. did you found a workaround ?
On Sunday, January 22, 2017 at 12:55:58 AM UTC+1, Lukas Girsch wrote:
Hi, iam trying to change a graph when a button is clicked.
this is what the two charts should look like
But when i try to change the lower graph, the upper one just disappears
This is the code i use to generate the layout:
curdoc().add_root(desc)
# set up layout
c1 = column(stock, days)
c2 = column(ts1)
r1 = row(c1, c2)
curdoc().add_root(r1)

cCalc = column(select_varianzred, daysToKeepTheStock, iterations, button)
c2Calc = column(hg1)
r2 = row(cCalc, c2Calc)
curdoc().add_root(r2)
(having just one add_root doesnt change the outcome)
and this is the code is use to replace the graph:
hg_ = figure(title="Histogram", id='histog', plot_width=900, plot_height=300, tools=tools)
hist_, edges_ = np.histogram(mc_returns, density=True, bins=50)
hg_.quad(top=hist_, bottom=0, left=edges_[:-1], right=edges_[1:])

r2.children[1] =hg_
iam thankful for any input
bokeh version 12.4
–
You received this message because you are subscribed to the Google Groups “Bokeh Discussion - Public” group.
To unsubscribe from this group and stop receiving emails from it, send an email to [email protected].
To post to this group, send email to [email protected].
To view this discussion on the web visit https://groups.google.com/a/continuum.io/d/msgid/bokeh/757f2d4e-95c2-4cdb-82cb-95ab31d73816%40continuum.io.
For more options, visit https://groups.google.com/a/continuum.io/d/optout.

