Changing text dynamically via dropdown menus

I built a scatterplot whose datapoint coordinates are changed by two dropdown menus. What I cannot do is adding some text that changes everytime I change what I plot. The text is provided by a correlation matrix, so that when I plot column a vs column b the following text should appear: “the correlation is: 0.80”. Is it even possible to do that? Usually I can access the correlation matrix elements with either numerical indices or column names (e.g. corr_mat[0][2] or corr_mat[‘moo’][‘woof’]), but this is lost passing to a ColumnDataSource.
Here is the code I’ve written so far:

from bokeh.io import show, output_notebook
from bokeh.models import ColumnDataSource, Select, Column, Row, CustomJS, PreText
from bokeh.plotting import figure
import pandas as pd
output_notebook()
data = {'moo': [1, 2, 3, 4],
        'woof': [20, 21, 19, 18],
        'purr': [33, 45, 12, 16]}
df = pd.DataFrame(data)
corr_mat = df.corr()
source = ColumnDataSource(df)
p = figure(plot_height=500, plot_width=500, x_axis_label="moo", y_axis_label="woof")
r = p.circle(x='moo', y='woof', source=source)
selecty = Select(value='woof', title='y-axis', options=list(df.columns))
selectx = Select(value='moo', title='x-axis', options=list(df.columns))
cby = CustomJS(args=dict(r=r, select=selecty, yaxis=p.yaxis), code="""
    // tell the glyph which field of the source y should refer to
    r.glyph.y.field = select.value;
    // change axis label accordingly
    yaxis[0].axis_label = select.value;
    // manually trigger change event to re-render
    r.glyph.change.emit()
""")
cbx = CustomJS(args=dict(r=r, select=selectx, xaxis=p.xaxis), code="""
    // tell the glyph which field of the source y should refer to
    r.glyph.x.field = select.value;
    // change axis label accordingly
    xaxis[0].axis_label = select.value;
    // manually trigger change event to re-render
    r.glyph.change.emit()
""")
selecty.js_on_change('value', cby)
selectx.js_on_change('value', cbx)
# I added this part just to show what I would like to see as a final product. 
# The number should be changing everytime I change the selection in dropdown menus
q = PreText(text = 'correlation: ' + str(corr_mat[selectx.value][selecty.value]))
# End of explanatory code
show(Row(Column(selecty, selectx, q), p))

BTW I asked the same queston here (the code is slightly different):

Thanks in advance
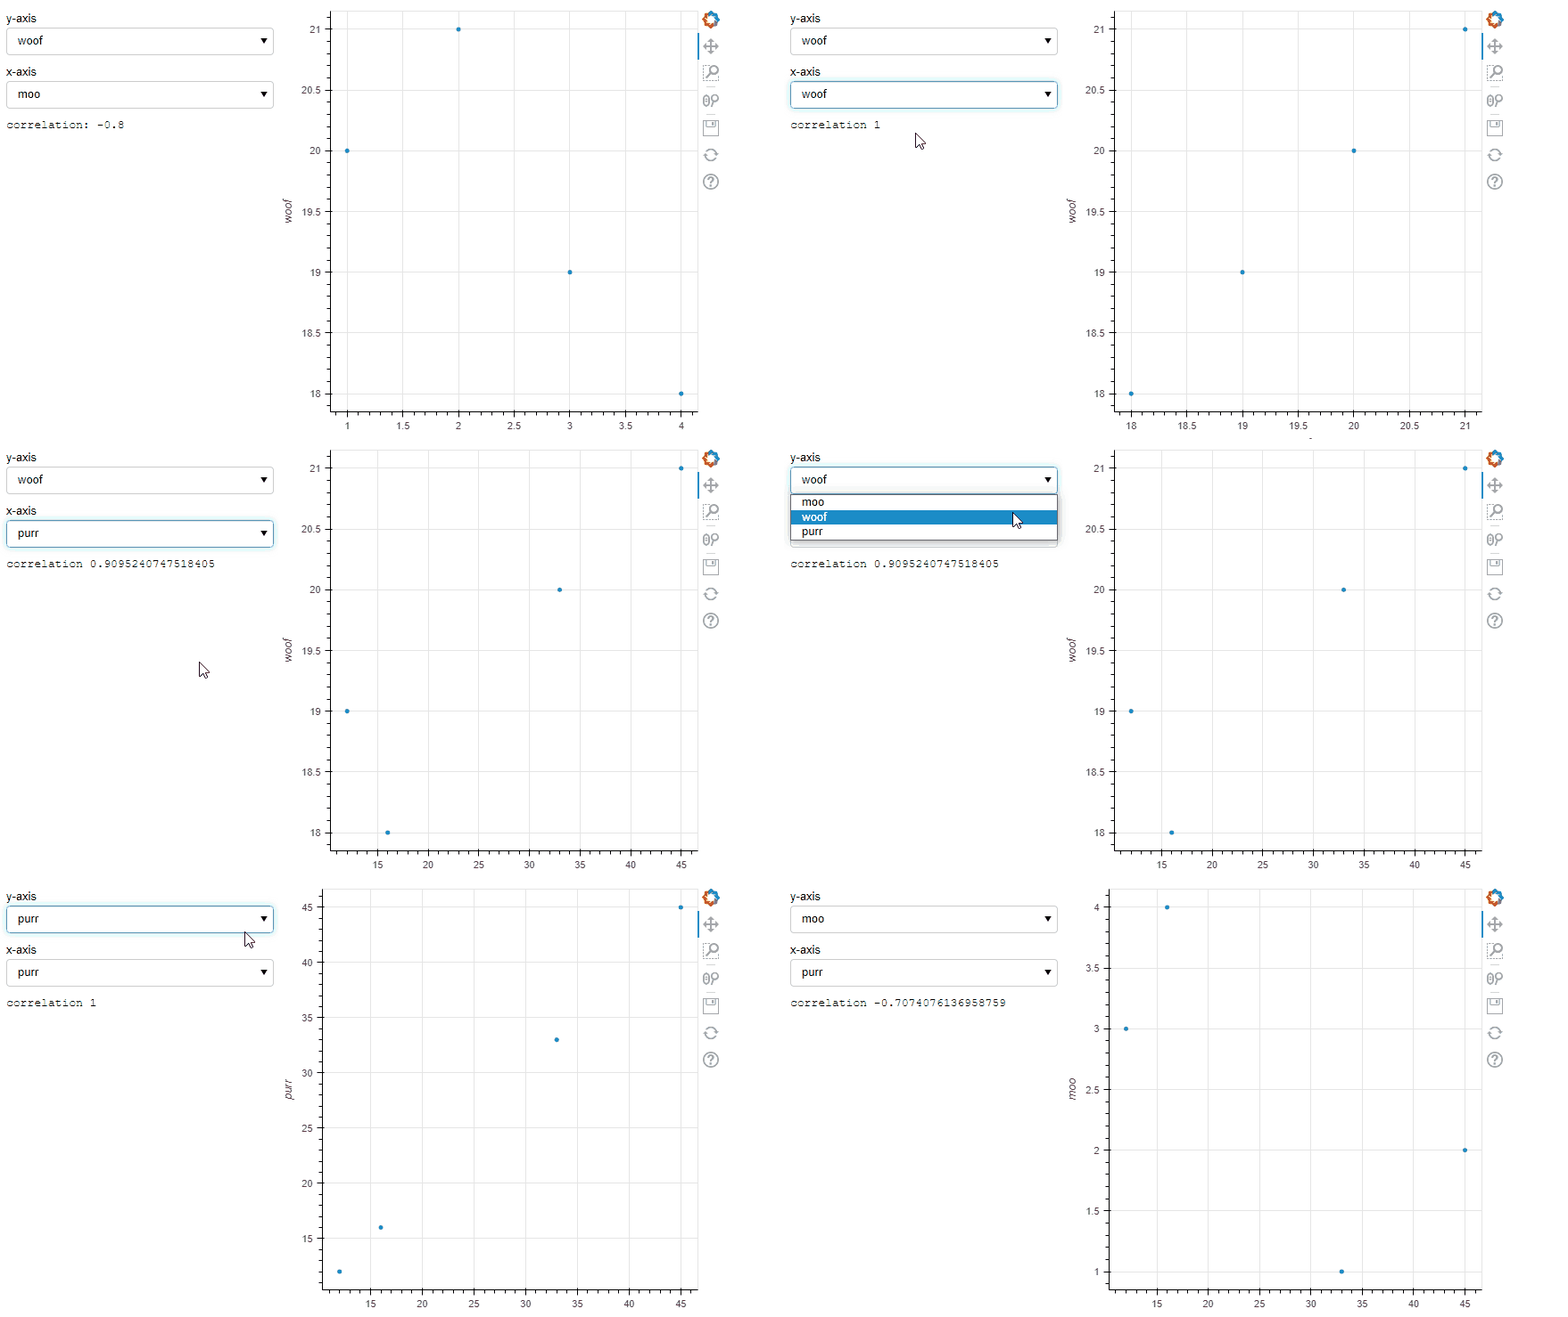
You’re very close. The key thing I think you were missing was that df_corr was not being passed to bokeh at all: you need to create a second ColumnDataSource that stores the correlation matrix along with a means of using the state of the select widgets to look up the correct one. Furthermore, your callback will then need to know the state of BOTH select values to look up the correct correlation coeff.

With that in mind, I simplified it down to one callback (i.e. the same callback happens when you change select.x or select.y). Read the comments carefully and when in doubt console.log the crap out of the callback to understand what’s happening:


# -*- coding: utf-8 -*-
"""
Created on Fri Aug 19 14:28:52 2022

@author: Gaelen
"""

from bokeh.io import show, output_notebook
from bokeh.models import ColumnDataSource, Select, Column, Row, CustomJS, PreText
from bokeh.plotting import figure
import pandas as pd
# output_notebook()
data = {'moo': [1, 2, 3, 4],
        'woof': [20, 21, 19, 18],
        'purr': [33, 45, 12, 16]}
df = pd.DataFrame(data)
corr_mat = df.corr()
source = ColumnDataSource(df)

#make a second columndatasource of your correlation matrix result
corr_source = ColumnDataSource(corr_mat)
#if you look at this object's data attribute (i.e. drop this into the console):
    # corr_source.data
# you'll see that bokeh "translates" your df into a dictionary where the keys are column names, and the values correspond to arrays containing the column values
# you'll also notice that bokeh makes an 'index' column storing the dataframe's index, which we can leverage


p = figure(plot_height=500, plot_width=500, x_axis_label="moo", y_axis_label="woof")
r = p.circle(x='moo', y='woof', source=source)
selecty = Select(value='woof', title='y-axis', options=list(df.columns))
selectx = Select(value='moo', title='x-axis', options=list(df.columns))

#need to update the callback a few different ways:
# one --> to report the correlation coefficient, we actually need to know the state of both selects, so gotta pass both selects as args
# two --> gotta pass the correlation matrix datasource to be able to retrieve the value corresponding to the state of both selects
# three --> since we gotta pass both selects in, we really might as well make just one callback that gets triggered when either select gets changed...
# four --> the PreText object will also need to be passed into the callback so you can update its text
#that'll really simplify things.

q = PreText(text = 'correlation: ' + str(corr_mat[selectx.value][selecty.value]))

cb = CustomJS(args=dict(r=r, selecty=selecty, yaxis=p.yaxis, xaxis=p.xaxis, selectx=selectx,corr_source=corr_source,q=q), code="""
    //get the values of both selects, easier shorthand 
    const yf = selecty.value
    const xf = selectx.value
    // tell the glyph which fields the source should refer to
    r.glyph.y.field = yf;
    r.glyph.x.field = xf;
    // change axis label accordingly
    yaxis[0].axis_label = yf
    xaxis[0].axis_label = xf
    // manually trigger change event to re-render
    r.glyph.change.emit()
    
    //new part, manipulating the coor_source to look up the correlation coeff.
    // in corr_source.data, the index key will correspond to your 'y'
    // so we need to find the index where yf (i.e. select.y.value) occurs in corr_source.data['index']
    const y_ind = corr_source.data['index'].indexOf(yf)
    // then we need to retrieve xf (i.e. select.x.value) at that index to get the right value in the matrix
    const c = corr_source.data[xf][y_ind]
    
    //then update q with that value
    q.text = 'correlation '+c.toString()    
""")

selecty.js_on_change('value', cb)
selectx.js_on_change('value', cb)

show(Row(Column(selecty, selectx, q), p))

corr

EDIT: Kudos on the super easy to work with MRE :smiley:

1 Like

Thank you so much for both code and explanation, it works like a charm! I didn’t know I could put all the code for both dropdown menus in a single callback (TBH I know basically nothing of JavaScript), that simplifies it a lot (I was struck trying to split the code for the text into the two callbacks, but it didn’t really make sense).

EDIT: Kudos on the super easy to work with MRE

I mean, my level is so low that I had to search for the meaning of MRE :rofl:
I hope that this example will be helpful for others. :smiley:

2 Likes

This topic was automatically closed 90 days after the last reply. New replies are no longer allowed.