Hi,
I’ve been making a data visualisation tool for fun for my YouTube channel data. Initially, I tried to make a grid layout for the same x-axis and different y axis variables from the data frame i’ve attached ‘yt.csv’. On the other hand, i’m using the jupyter notebook to make these plots and Python 3.5, Pandas 0.20.2, Seaborn 0.7.1 and Bokeh 0.12.2. Here’s the code i used to make the plot i mention initially.
Making the necessary imports
from bokeh.plotting import figure
from bokeh.io import output_file, output_notebook, show
from bokeh.layouts import column
from bokeh.models import HoverTool, ColumnDataSource
convert column to a datetime
df1[‘date’] = pd.to_datetime(df1[‘date’])
df1[“date”]
create a new plot with a datetime axis type
putting it in a fixed area
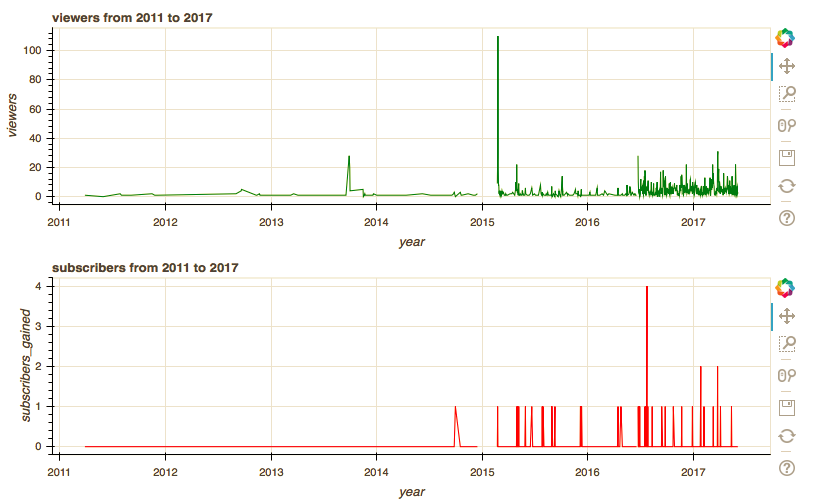
p = figure(plot_width = 800, plot_height = 250, title = “viewers from 2011 to 2017”,
x_axis_label = “year”, y_axis_label = “viewers”, x_axis_type =“datetime”)
p2 = figure(plot_width = 800, plot_height = 250,title = “subscribers from 2011 to 2017”,
x_axis_label = “year”, y_axis_label = “subscribers_gained”, x_axis_type =“datetime”)
add line glyph
p.line(df1[“date”], df1[“views”], color = “green”)
p2.line(df1[“date”], df1[“subscribers_gained”], color = “red”)
put plots p1 and p2 on a column
layout = column(p,p2)
embed plot to notebook
output_notebook()
show result
show(layout)
This what i got.
Then i thought what if i keep the x-axis constant and change the y-axis. Here’s an attempt. But notice the plot doesn’t update even after changing the variable of the y-axis. Here’s the code i used to generate it.
Making the necessary imports
from bokeh.models import ColumnDataSource
from bokeh.models import Select
from bokeh.layouts import row
from bokeh.io import curdoc
from bokeh.layouts import widgetbox
from bokeh.models import Slider
Create ColumnDataSource: source
source = ColumnDataSource(data={
‘x’ : df1[“date”],
‘y’ : df1[“views”]
})
Create a plot
plot = figure(x_axis_type =“datetime”)
Add lines to the plot
plot.line(‘x’, ‘y’, source = source, legend = “Sliceace”)
Defining a callback function
def update_plot(attr, old, new):
if the new selection is views
if new == “views”:
source.data = {
“x” : df1[“date”],
“y” : df1[“views”]
}
else, update y
else:
source.data = {
“x” : df1[“date”],
“y” : df1[“subscribers”]
}
remove the date column
columns = df1.drop(‘date’, axis = 1)
columns = sorted(df.columns)
create a dropdown select widget
select = Select(title = “y-axis”, options = [‘likes’, ‘dislikes’, ‘subscribers_gained’, ‘subscribers’], value = “views”)
Attach the update_plot callback to the ‘value’ property of select
select.on_change(“value”, update_plot)
Create layout and add to current document
layout2 = row(select, plot)
curdoc().add_root(layout2)
output_notebook()
show(layout2)
The plot i got
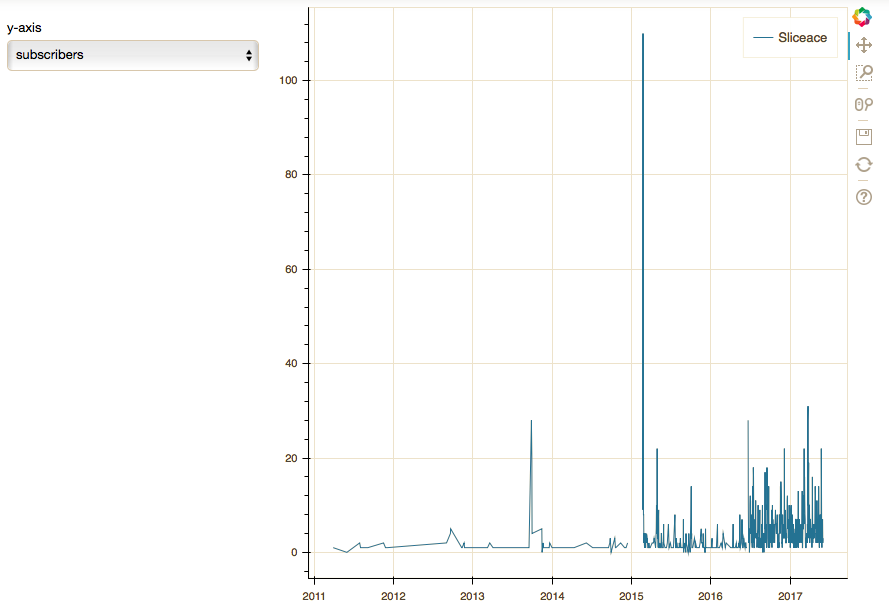
Notice that the y-axis is the views column and is not updating. So my question is, how can i update the y-axis to draw different variables available in the dataset(“yt.csv”). While keeping the x-axis constant? And why isn’t my y-axis updating as i’m changing my Selection in the dropdown?
Looking forward to your responses.
Regards,
Nyabuti Mainye.
yt.csv (92.5 KB)