Hello :),
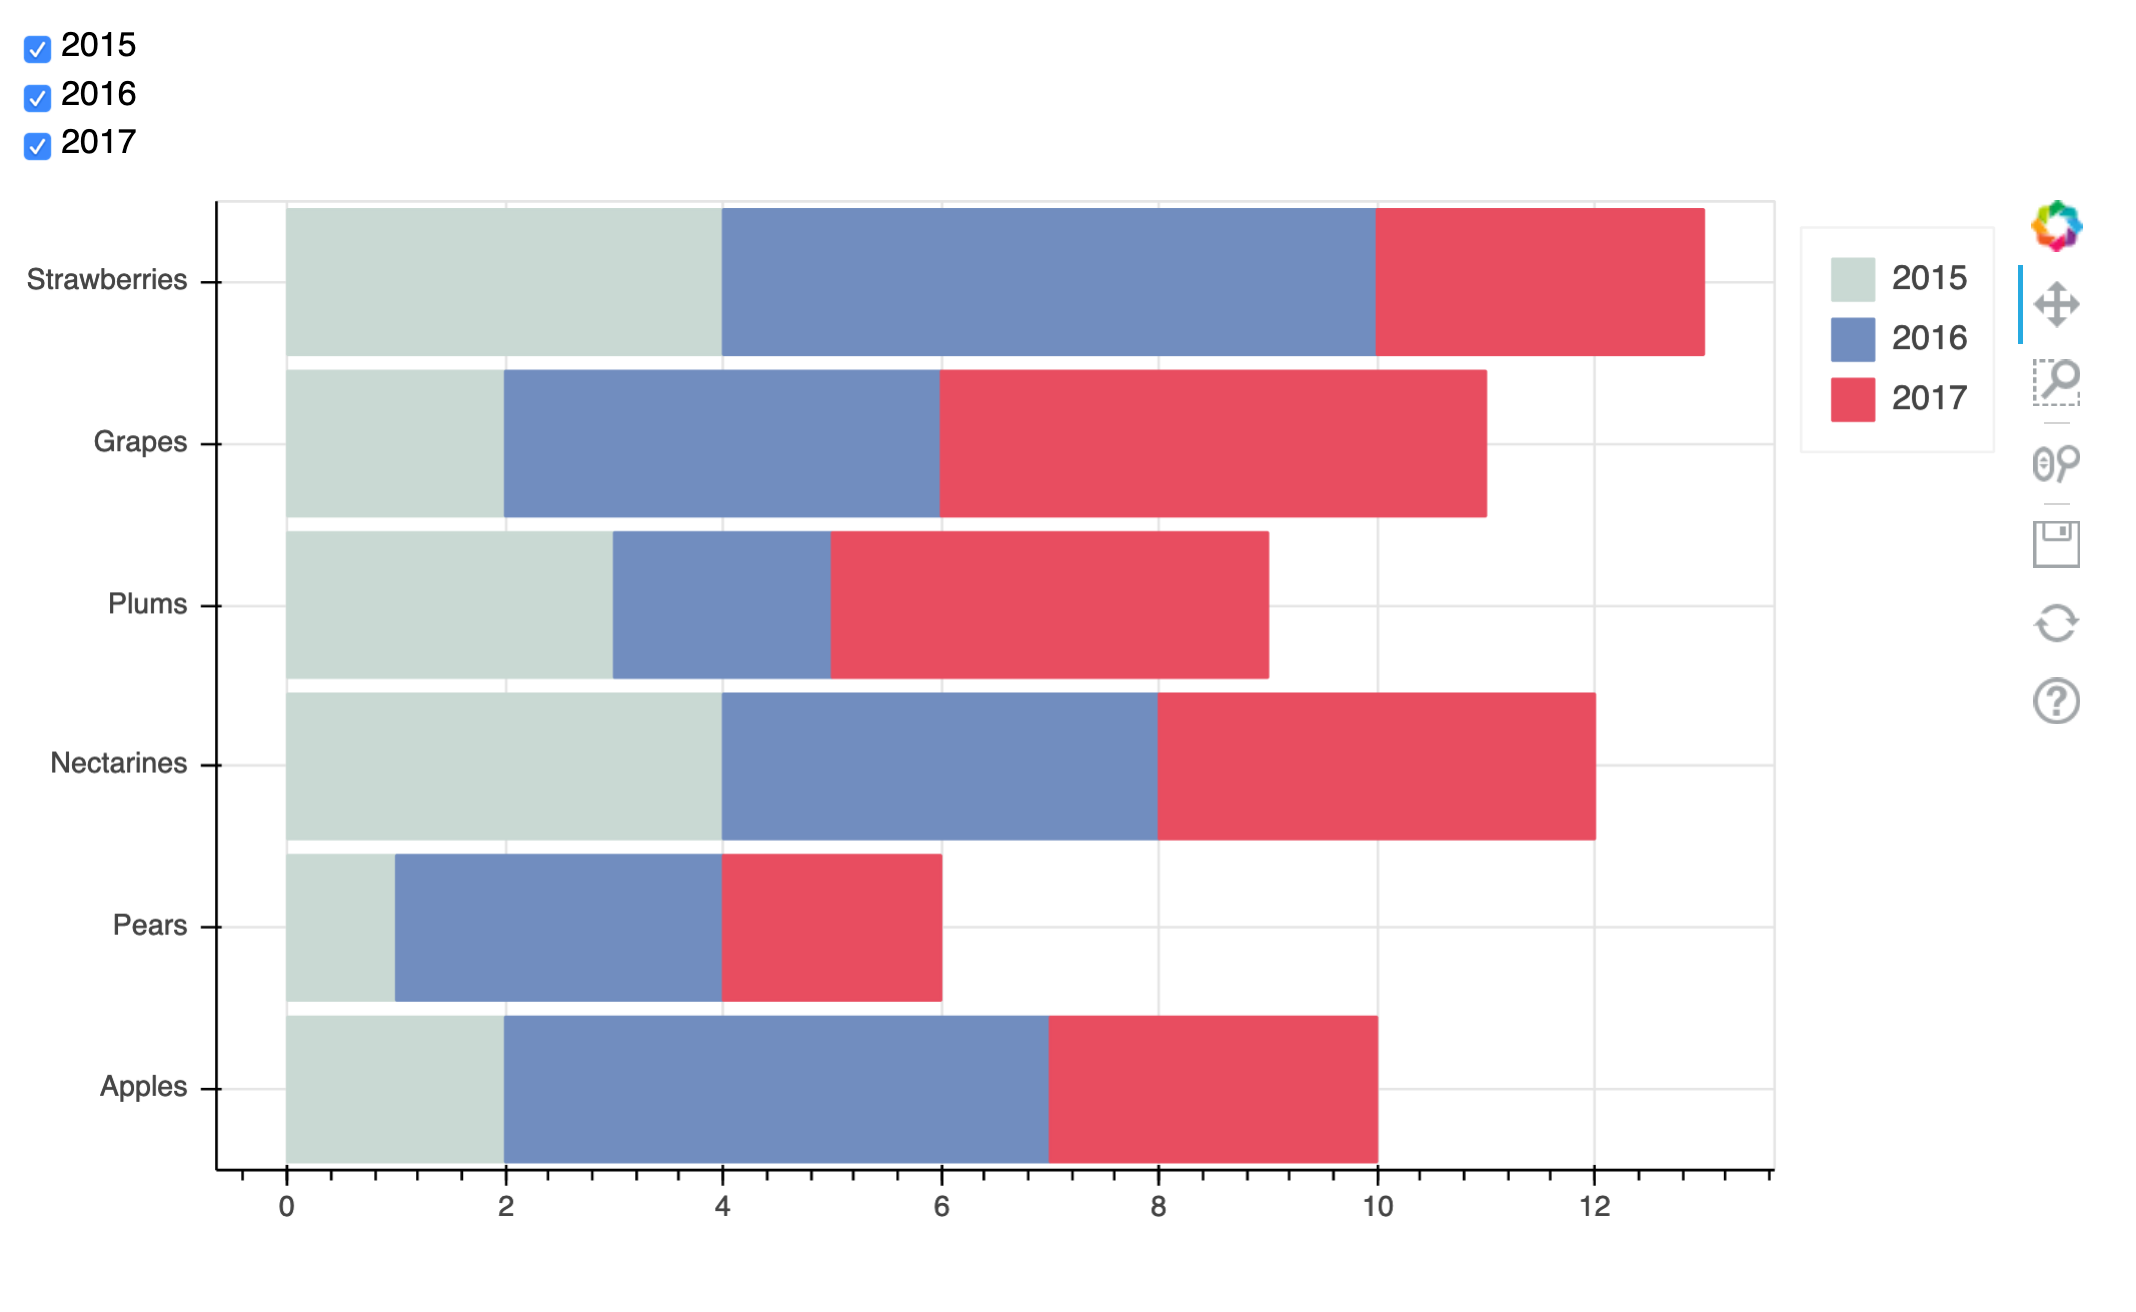
I use Bokeh to be able to modify my figure with checkboxes. This code makes appear a figure hbar, and the checkbox modified the number of date represented. (the number of color per bar) (see Figure). My code works but I would like to use a callback with CustumJS and not in python to save my html. For the moment my callback is update_plot but I would like to use a JavaScript callback with CustomJS,
I tried this in the code bellow but it didn’t work :
update = CustomJS(args=dict(LABEL=LABEL, renderers=renderers),
                      code="""
                         const col_acc = []
                         const Stack = Bokeh.Models('Stack');
                         for(let i=0; i < LABEL.length; i + +){
                         if (cb_obj.active.includes(i)){
                             renderers[i].visible = true;
                             renderers[i].left = {expr: new Stack({fields: col_acc})};
                            col_acc.push(LABEL[i]);
                            renderers[i].right = {expr: new Stack({fields: col_acc})};}
                         else {
                            renderers[i].visible = false;}
                         }
""")
checkbox_group.js_on_click(update)
Thanks 
import pandas as pd
from bokeh.layouts import column, grid, row
from bokeh.models import (Button, CheckboxGroup, ColumnDataSource, CustomJS,
                          Grid, HoverTool, LabelSet, Legend, LegendItem
from bokeh.plotting import ColumnDataSource, curdoc, figure, output_file, show
from bokeh.transform import stack
from matplotlib import pyplot as plt

output_file("stacked.html")

fruits = ['Apples', 'Pears', 'Nectarines', 'Plums', 'Grapes', 'Strawberries']
LABEL = ["2015", "2016", "2017"]
C = ["#c9d9d3", "#718dbf", "#e84d60"]

data = {'2015': [2, 1, 4, 3, 2, 4],
        '2016': [5, 3, 4, 2, 4, 6],
        '2017': [3, 2, 4, 4, 5, 3]}
df = pd.DataFrame(data=data)
df.index = fruits
source = ColumnDataSource(df)

p = figure(plot_width=800, plot_height=400,
           y_range=list(df.index.drop_duplicates().tolist()))
renderers = []
col_acc = []
legend = []
for col in LABEL:
    r = p.hbar(y='index', left=stack(*col_acc), right=stack(col, *col_acc),
               height=0.9, color=C[int(LABEL.index(col))], source=source)
    col_acc.append(col)
    renderers.append(r)
    print(r, col, col_acc, stack(*col_acc))

legend_items = [LegendItem(label=LABEL[i], renderers=[renderers[i]])
                for i in range(len(LABEL))]
p.add_layout(Legend(items=legend_items), 'right')

checkbox_group = CheckboxGroup(labels=LABEL, active=list(range(len(LABEL))))


def update_plot(new):
    Col_a = []
    for i in range(len(LABEL)):
        if i in new:
            renderers[i].visible = True
            renderers[i].glyph.left = stack(*Col_a)
            renderers[i].glyph.right = stack(LABEL[i], *Col_a)
            Col_a.append(LABEL[i])
        else:
            renderers[i].visible = False
    p.legend.items = [legend_items[i] for i in checkbox_group.active]


checkbox_group.on_click(update_plot)

group = column(checkbox_group, p)
layout = row(group)
curdoc().add_root(layout)
show(layout)