Last Christmas I shared with my colleagues a similar custom plot to show the temperature evolution. It is so wonderful, isn’t it?
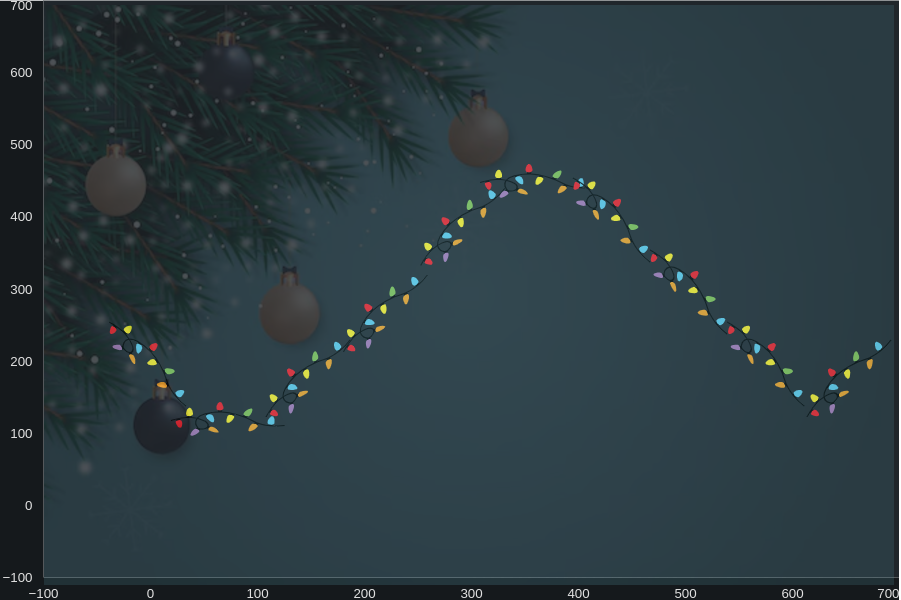
I am plotting some svg glyphs with custom rotations to represent the big image of the timeseries evolution.
import numpy as np

from bokeh.io import curdoc, show, curdoc
from bokeh.models import ColumnDataSource, Grid, ImageURL, LinearAxis, Plot, Range1d, Div, Row
curdoc().theme = 'dark_minimal'

url = "https://raw.githubusercontent.com/mixstam1821/bokeh_showcases/refs/heads/main/assets0/Christmas%20Lights.svg"
N = 10

source = ColumnDataSource(dict(
    url = [url]*N,
    x1  = np.linspace(  0, 650, N),
    y1  = np.array([200,120,180,270,390,450,400,300,200,180]),#np.linspace(  0, 650, N),
    w1  = np.repeat(120, N),
    h1  = np.repeat(120, N),
    angle = np.array([-np.pi/4,0,np.pi/4,np.pi/4,np.pi/4,0,-np.pi/4,-np.pi/4,-np.pi/4,np.pi/4]),
))

xdr = Range1d(start=-100, end=700)
ydr = Range1d(start=-100, end=700)

plot = Plot(
    title=None, x_range=xdr, y_range=ydr, width=900, height=600,
    min_border=0, toolbar_location=None)

image1 = ImageURL(url="url", x="x1", y="y1", w="w1", h="h1", anchor="center",angle='angle',global_alpha = 1)
plot.add_glyph(source, image1)

xaxis = LinearAxis()
plot.add_layout(xaxis, 'below')

yaxis = LinearAxis()
plot.add_layout(yaxis,'left')

plot.add_layout(Grid(dimension=0, ticker=xaxis.ticker))
plot.add_layout(Grid(dimension=1, ticker=yaxis.ticker))
# plot.axis.visible = False
plot.grid.visible = False
plot.outline_line_color = None
url = "https://img.freepik.com/premium-vector/christmas-background-decoration-with-white-golden-style_497837-359.jpg"#"https://i.pinimg.com/736x/89/ae/75/89ae755d63034254aaae93c9cf112cf3.jpg"
d1 = Div(text = '<div style="position: absolute; left:-860px; top:0px"><img src=' + url + ' style="width:850px; height:580px; opacity: 0.2"></div>')

show(Row(plot, d1))