I find myself constantly referring to old plots to remember how use LinearColorMapper and LogColorMapper and realized I’ve been using them wrong. Well not wrong, but I was writing the DataSpec property when really you can use the _cmap functions and save some syntax.
Anyway, I decided the mappers should be documented along with the palettes so I have updated the “Styling Visual Attributes” page of the user guide to highlight them.
I was hoping I could get some feedback before opening a PR as this would be first contribution to the project.
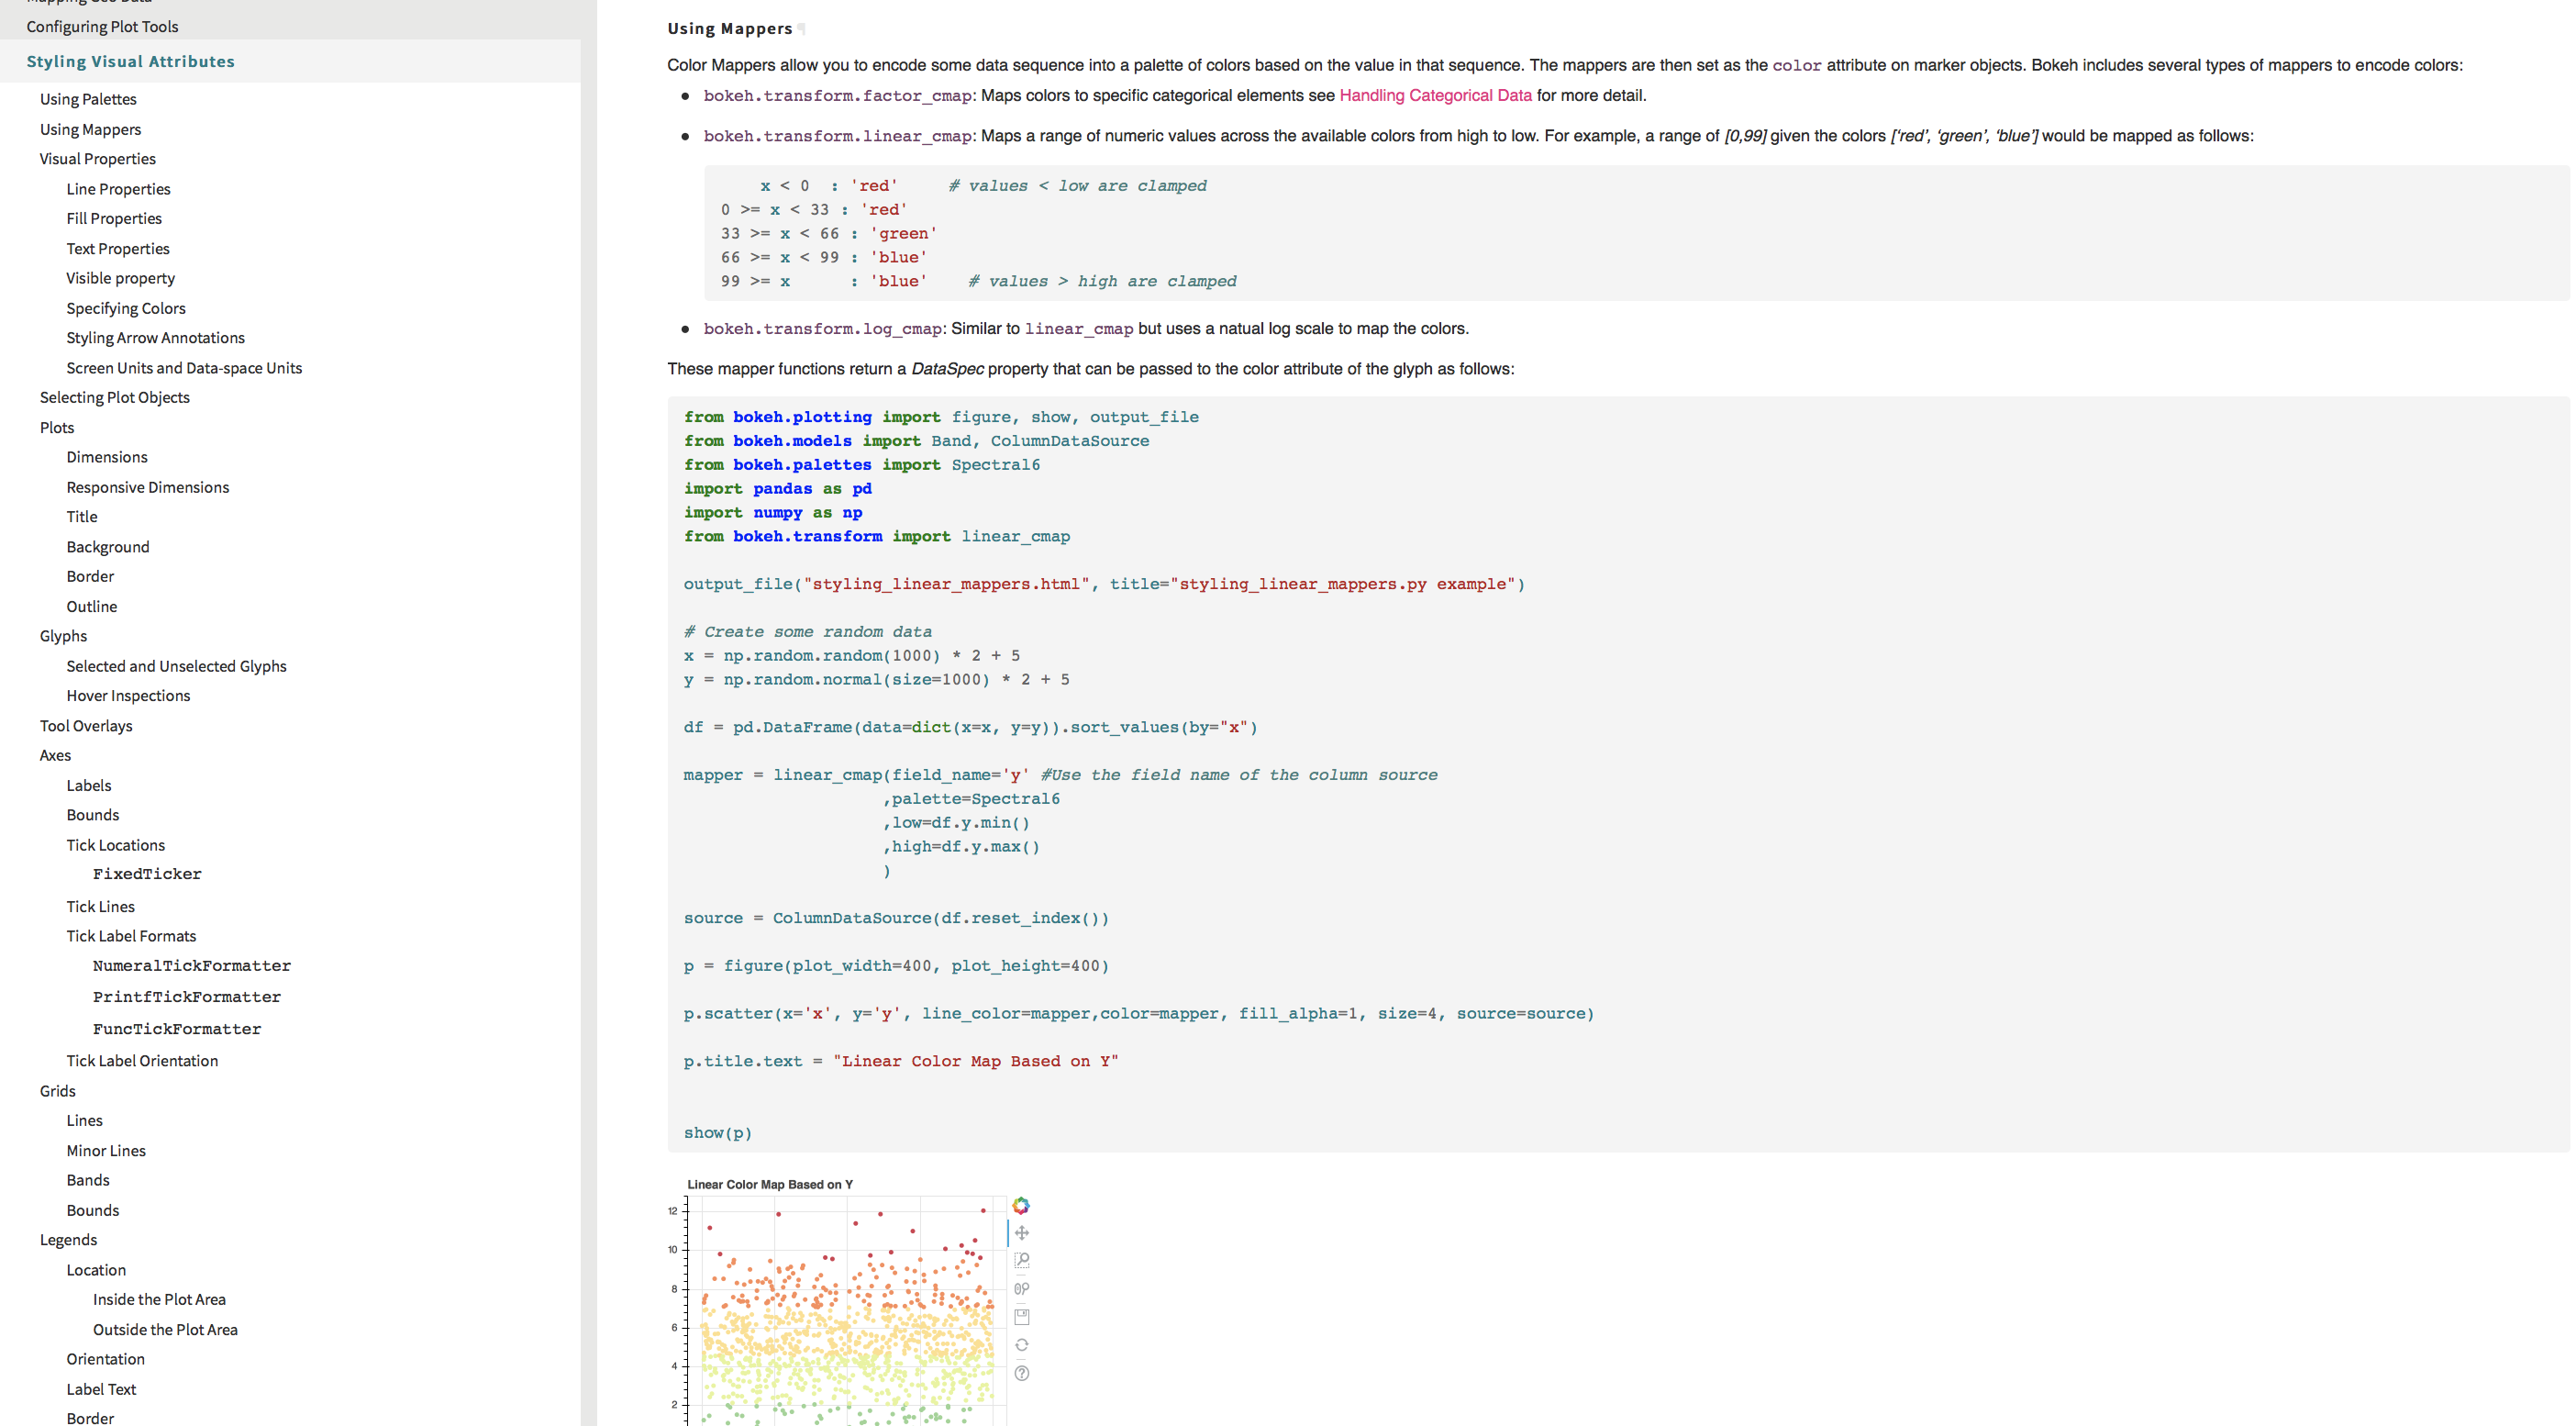
I have attached a screenshot of the page on the local build and I can post the text here.
I think it would be great to add more docs about color mappers, you are correct that this has not gotten enough attention. I think your example and text is nice my only comments are :
* use "circle" rather than "scatter" It's not going away, but I don't really like to promote it either
* comma-first arg passing style is not used anywhere else, it would be better to match style with other examples
* do the values need to be sorted? Would be good to shorten/remove pandas dependence
* title can be passed directly to figure
Looking forward to your PR!
As an aside, I'd say it's always good just to make the PR first, BTW. The GitHub UI tools make it easier to make comments directly in the PR.
I find myself constantly referring to old plots to remember how use LinearColorMapper and LogColorMapper and realized I've been using them wrong. Well not wrong, but I was writing the DataSpec property when really you can use the _cmap functions and save some syntax.
Anyway, I decided the mappers should be documented along with the palettes so I have updated the "Styling Visual Attributes" page of the user guide to highlight them.
I was hoping I could get some feedback before opening a PR as this would be first contribution to the project.
I have attached a screenshot of the page on the local build and I can post the text here.