color and maker treated differently in scatter()

Hi again,

Maybe my intuition is off here, apologies in that case. But consider this example:

import numpy as np

from bokeh.io import curdoc
from bokeh.plotting import Figure
from bokeh.models import ColumnDataSource

xdata, ydata = ,
colors = [’#ff0000’, ‘#00ff00’, ‘#0000ff’]
#markers = [‘circle’, ‘square’, ‘diamond’]
num_x, intercept = 7, 2.5
for slope in [2.5, 3.5, 4.5]:
xdata.append(np.linspace(0, 10, num_x))
ydata.append(intercept + slope*xdata[-1] + np.random.random(num_x))

source = ColumnDataSource(data={‘x’: , ‘y’: , ‘color’: ,
#‘marker’:
})
for idx, (x, y) in enumerate(zip(xdata, ydata)):
source.data[‘x’].extend(list(x))
source.data[‘y’].extend(list(y))
source.data[‘color’].extend([colors[idx]]*len(x))
#source.data[‘marker’].extend([markers[idx]]*len(x))

f = Figure()
f.scatter(
x=‘x’, y=‘y’, source=source, color=‘color’,
#marker=‘marker’
)

curdoc().add_root(f)

``

I would have expected that the uncommented code would work, which it unfortunately does not, it raises an exception:

ValueError: Invalid marker type ‘marker’. Use markers() to see a list of valid marker types.

The marker kwarg should arguably be analogous with color kwarg, but this is not the case.
I guess I could create as many different ColumnDataSources as I want markers and loop over markers:

for midx, marker in enumerate(markers):
getattr(f, marker)(x=‘x’, y=‘y’, color=‘color’, source=sources[midx])

``

is that what’s recommended?

Best regards,
Björn Dahlgren
Hi Björn,

In Bokeh, markers are all distinct Bokeh models. You can configure a particualr marker with data and other attributes, and that marker will draw itself accordingly. It is not possible to specify the "marker type" itself as "data", or in other words there is no "generic marker scatter renderer" in BokehJS that can vary according to marker type. To do this at the low level, or with bokeh.plotting, you'd need to partition your data, and create different markers to plot each partition.

    f.scatter(marker="circle", ...)
    f.scatter(marker="square", ...)

or as I more commonly do:

    f.circle(...)
    f.square(...)

However, the is a high level bokeh.charts.Scatter chart that might be useful to you, it can basically take care of all of this for you, assigning a different marker to various groups in your data automatically:

  http://bokeh.pydata.org/en/latest/docs/user_guide/charts.html#userguide-charts-scatter-marker

It's possible that adding a "scatter" primitive to BokehJS that can vary over marker types (i.e. so the marker type itself can be "data") could be a useful feature addition to Bokeh, if you are interested in helping to develop such a feature please let us know.

Bryan

···

On Mar 2, 2016, at 11:36 AM, Björn Dahlgren <[email protected]> wrote:

Hi again,

Maybe my intuition is off here, apologies in that case. But consider this example:

import numpy as np

from bokeh.io import curdoc
from bokeh.plotting import Figure
from bokeh.models import ColumnDataSource

xdata, ydata = ,
colors = ['#ff0000', '#00ff00', '#0000ff']
#markers = ['circle', 'square', 'diamond']
num_x, intercept = 7, 2.5
for slope in [2.5, 3.5, 4.5]:
    xdata.append(np.linspace(0, 10, num_x))
    ydata.append(intercept + slope*xdata[-1] + np.random.random(num_x))

source = ColumnDataSource(data={'x': , 'y': , 'color': ,
                                #'marker':
                            })
for idx, (x, y) in enumerate(zip(xdata, ydata)):
    source.data['x'].extend(list(x))
    source.data['y'].extend(list(y))
    source.data['color'].extend([colors[idx]]*len(x))
    #source.data['marker'].extend([markers[idx]]*len(x))

f = Figure()
f.scatter(
    x='x', y='y', source=source, color='color',
    #marker='marker'
)

curdoc().add_root(f)

I would have expected that the uncommented code would work, which it unfortunately does not, it raises an exception:

ValueError: Invalid marker type 'marker'. Use markers() to see a list of valid marker types.

The ``marker`` kwarg should arguably be analogous with ``color`` kwarg, but this is not the case.
I guess I could create as many different ColumnDataSources as I want markers and loop over markers:

for midx, marker in enumerate(markers):
     getattr(f, marker)(x='x', y='y', color='color', source=sources[midx])

is that what's recommended?

Best regards,
Björn Dahlgren

--
You received this message because you are subscribed to the Google Groups "Bokeh Discussion - Public" group.
To unsubscribe from this group and stop receiving emails from it, send an email to [email protected].
To post to this group, send email to [email protected].
To view this discussion on the web visit https://groups.google.com/a/continuum.io/d/msgid/bokeh/3b777b3a-94d2-4823-83c7-af08383928ca%40continuum.io\.
For more options, visit https://groups.google.com/a/continuum.io/d/optout\.

This seems related to a problem I’ve been trying to find a solution for.

If I did plot:

f.circle(…)

f.square(…)

When using “box_select” for example, is it possible to cause all the circles to be unselected when I select just some squares?

Thanks!
-Brian

···

On Wednesday, March 2, 2016 at 12:36:17 PM UTC-5, Björn Dahlgren wrote:

Hi again,

Maybe my intuition is off here, apologies in that case. But consider this example:

import numpy as np

from bokeh.io import curdoc
from bokeh.plotting import Figure
from bokeh.models import ColumnDataSource

xdata, ydata = ,
colors = [‘#ff0000’, ‘#00ff00’, ‘#0000ff’]
#markers = [‘circle’, ‘square’, ‘diamond’]
num_x, intercept = 7, 2.5
for slope in [2.5, 3.5, 4.5]:
xdata.append(np.linspace(0, 10, num_x))
ydata.append(intercept + slope*xdata[-1] + np.random.random(num_x))

source = ColumnDataSource(data={‘x’: , ‘y’: , ‘color’: ,
#‘marker’:
})
for idx, (x, y) in enumerate(zip(xdata, ydata)):
source.data[‘x’].extend(list(x))
source.data[‘y’].extend(list(y))
source.data[‘color’].extend([colors[idx]]*len(x))
#source.data[‘marker’].extend([markers[idx]]*len(x))

f = Figure()
f.scatter(
x=‘x’, y=‘y’, source=source, color=‘color’,
#marker=‘marker’
)

curdoc().add_root(f)

``

I would have expected that the uncommented code would work, which it unfortunately does not, it raises an exception:

ValueError: Invalid marker type ‘marker’. Use markers() to see a list of valid marker types.

The marker kwarg should arguably be analogous with color kwarg, but this is not the case.
I guess I could create as many different ColumnDataSources as I want markers and loop over markers:

for midx, marker in enumerate(markers):
getattr(f, marker)(x=‘x’, y=‘y’, color=‘color’, source=sources[midx])

``

is that what’s recommended?

Best regards,
Björn Dahlgren

Hi Brian,

Can you elaborate more / provide some code? If you have one box select tool that is configured to select on all available renderers, then selecting just some squares means that everything except those squares will be deselected (including all circles, by definition) So there must be something else going on that I'm not understanding, or misinterpreting.

Bryan

···

On Mar 2, 2016, at 2:32 PM, Brian Puchala <[email protected]> wrote:

This seems related to a problem I've been trying to find a solution for.

If I did plot:

   f.circle(...)
   f.square(...)

When using "box_select" for example, is it possible to cause all the circles to be unselected when I select just some squares?

Thanks!
-Brian

On Wednesday, March 2, 2016 at 12:36:17 PM UTC-5, Björn Dahlgren wrote:
Hi again,

Maybe my intuition is off here, apologies in that case. But consider this example:

import numpy as np

from bokeh.io import curdoc
from bokeh.plotting import Figure
from bokeh.models import ColumnDataSource

xdata, ydata = ,
colors = ['#ff0000', '#00ff00', '#0000ff']
#markers = ['circle', 'square', 'diamond']
num_x, intercept = 7, 2.5
for slope in [2.5, 3.5, 4.5]:
    xdata.append(np.linspace(0, 10, num_x))
    ydata.append(intercept + slope*xdata[-1] + np.random.random(num_x))

source = ColumnDataSource(data={'x': , 'y': , 'color': ,
                                #'marker':
                            })
for idx, (x, y) in enumerate(zip(xdata, ydata)):
    source.data['x'].extend(list(x))
    source.data['y'].extend(list(y))
    source.data['color'].extend([colors[idx]]*len(x))
    #source.data['marker'].extend([markers[idx]]*len(x))

f = Figure()
f.scatter(
    x='x', y='y', source=source, color='color',
    #marker='marker'
)

curdoc().add_root(f)

I would have expected that the uncommented code would work, which it unfortunately does not, it raises an exception:

ValueError: Invalid marker type 'marker'. Use markers() to see a list of valid marker types.

The ``marker`` kwarg should arguably be analogous with ``color`` kwarg, but this is not the case.
I guess I could create as many different ColumnDataSources as I want markers and loop over markers:

for midx, marker in enumerate(markers):
     getattr(f, marker)(x='x', y='y', color='color', source=sources[midx])

is that what's recommended?

Best regards,
Björn Dahlgren

--
You received this message because you are subscribed to the Google Groups "Bokeh Discussion - Public" group.
To unsubscribe from this group and stop receiving emails from it, send an email to [email protected].
To post to this group, send email to [email protected].
To view this discussion on the web visit https://groups.google.com/a/continuum.io/d/msgid/bokeh/c92a9a9d-5956-45ed-b7b1-31ed726dd243%40continuum.io\.
For more options, visit https://groups.google.com/a/continuum.io/d/optout\.

Here is an example:

import numpy as np
import pandas
from bokeh.plotting import output_file, show, Figure, curdoc
from bokeh.models import BoxSelectTool, ColumnDataSource, Circle, Square
from bokeh.io import output_server

output_server()

random data points

N = 100
max = 100
x1 = np.random.random(size=N) * max
y1 = np.random.random(size=N) * max
df = pandas.DataFrame(data=dict({‘x1’:x1, ‘y1’:y1}))

by some criteria, I want to plot some points as circles and some as squares

src_circ = ColumnDataSource(data=df[df[‘y1’]<50.])
src_sqr = ColumnDataSource(data=df[df[‘y1’]>=50.])

f = Figure(plot_width = 400, plot_height = 400, x_range = (0,max), y_range = (0,max))
m1 = f.circle(x=‘x1’, y=‘y1’, source=src_circ, color=“blue”)
m2 = f.square(x=‘x1’, y=‘y1’, source=src_sqr, color=“red”)
f.add_tools(BoxSelectTool())

m1.selection_glyph = Circle(fill_alpha=1, fill_color=“green”, line_color=None)
m1.nonselection_glyph = Circle(fill_alpha=0.2, fill_color=“purple”, line_color=None)

m2.selection_glyph = Square(fill_alpha=1, fill_color=“orange”, line_color=None)
m2.nonselection_glyph = Square(fill_alpha=0.2, fill_color=“yellow”, line_color=None)

now, if I select only some circles, the squares all stay red, but I’d like them to turn yellow

curdoc().add_root(f)
show(curdoc())

``

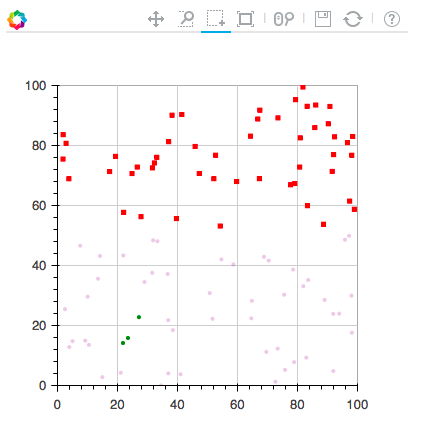
Which gives the following after selecting three blue circles:

Here is the image I tried to copy and paste

Oh, I see. Glyphs have three relevant possible states: normal, selected, nonselected. Selections are recorded on a per-datasource basis. If there is a *non-empty* selection on a data source, then the glyphs that use that data source are partitioned and represented as selected/nonselected and drawn with those policies. But if there is an *empty* selection on a data source, that is regarded as "no selection" and the glyphs that use that data source are just drawn as normal. That is what is happening here, since you have two data sources.

I am not sure there is any trivial solution to this. I think if you want to enforce more customized behaviour, you will have to look at using CustomJS callbacks on selections to update the glyphs visual properties by hand. There is more information about JS callbacks in the User's guide here:

  http://bokeh.pydata.org/en/latest/docs/user_guide/interaction.html#javascript-callbacks

Check that out first, and then if you have questions about what to actually have the JS do we can try to help (and perhaps you can contribute a new example to the documentation as a result).

Thanks,

Bryan

···

On Mar 2, 2016, at 4:14 PM, Brian Puchala <[email protected]> wrote:

Here is the image I tried to copy and paste

--
You received this message because you are subscribed to the Google Groups "Bokeh Discussion - Public" group.
To unsubscribe from this group and stop receiving emails from it, send an email to [email protected].
To post to this group, send email to [email protected].
To view this discussion on the web visit https://groups.google.com/a/continuum.io/d/msgid/bokeh/39d84030-2663-4229-aa68-d74a4f629de6%40continuum.io\.
For more options, visit https://groups.google.com/a/continuum.io/d/optout\.
<Screen Shot 2016-03-02 at 5.07.43 PM.png>

So if I understand correctly, to set the glyphs into the selected/unselected state I need a non-empty selection indices array. But I really do want an empty selection indices array so that all points from one datasource appear unselected.

I tried this hack where I add a selected index outside of the range of allowed indices. I don’t have much javascript experience and I’m not sure what kind of problems that could cause. It does work for one datasource but for some reason I’m not seeing it doesn’t work for the other one. I’d appreciate better suggestions. Maybe I could temporarily change the normal glyph to the nonselection_glyph?

Cheers,

Brian

import numpy as np
import pandas
from bokeh.plotting import output_file, show, Figure, curdoc
from bokeh.models import BoxSelectTool, ColumnDataSource, Circle, Square, CustomJS
from bokeh.io import output_server

output_server()

random data points

N = 100
max = 100

x1 = np.random.random(size=N) * max
y1 = np.random.random(size=N) * max
df = pandas.DataFrame(data=dict({‘x1’:x1, ‘y1’:y1}))

by some criteria, I want to plot some points as circles and some as squares

src_circ = ColumnDataSource(data=df[df[‘y1’]<50.])
src_sqr = ColumnDataSource(data=df[df[‘y1’]>=50.])

f = Figure(plot_width = 400, plot_height = 400, x_range = (0,max), y_range = (0,max))
m1 = f.circle(x=‘x1’, y=‘y1’, source=src_circ, color=“blue”)
m2 = f.square(x=‘x1’, y=‘y1’, source=src_sqr, color=“red”)
f.add_tools(BoxSelectTool())

m1.selection_glyph = Circle(fill_alpha=1, fill_color=“green”, line_color=None)
m1.nonselection_glyph = Circle(fill_alpha=0.2, fill_color=“purple”, line_color=None)

m2.selection_glyph = Square(fill_alpha=1, fill_color=“orange”, line_color=None)
m2.nonselection_glyph = Square(fill_alpha=0.2, fill_color=“yellow”, line_color=None)

now, if I select only some squares, the circles turn purple

src_sqr.callback = CustomJS(args=dict(s2=src_circ), code="""
var s1_inds = cb_obj.get(‘selected’)[‘1d’].indices;
var s2_inds = s2.get(‘selected’)[‘1d’].indices;
if(s1_inds.length > 0 && s2_inds.length == 0) {
s2.get(‘selected’)[‘1d’].indices = [s2.get(‘data’)[‘y1’].length];
}
“”")

but, if I select only some circles, the squares still all stay red

src_circ.callback = CustomJS(args=dict(s2=src_sqr), code="""
var s1_inds = cb_obj.get(‘selected’)[‘1d’].indices;
var s2_inds = s2.get(‘selected’)[‘1d’].indices;
if(s1_inds.length > 0 && s2_inds.length == 0) {
s2.get(‘selected’)[‘1d’].indices = [s2.get(‘data’)[‘y1’].length];
}
“”")

curdoc().add_root(f)
show(curdoc())

``

Brian,

That is correct. There's really no way to disambiguate whether "empty selection indices" means no selection was made, or that a selection was made and it happened to be empty. "normal" is the more common state of affairs, that was made the default for that case. So then "nonselection" is only meaningful in contrast to there actually being currently selected points.

What you suggest might happen to be workable as an accidental workaround, I'm not sure, but it's not exactly what I had in mind. I was suggesting that you could pass the glyph renderers m1 and m2 as arguments to your CustomJS callback. Then in the callback, if you determine that all the circles should change appearance for whatever reason (because another source has an active selection, or whatever), you can do things like:

  glyph = m1.get('glyph')
  glyph.set('fill_color', 'yellow')
  glyph.set('fill_alpha', 0.5)

And that will cause all the circles to turn yellow and half-alpha (untested, but hopefully it points the way).

Thanks,

Bryan

···

On Mar 2, 2016, at 11:58 PM, Brian Puchala <[email protected]> wrote:

So if I understand correctly, to set the glyphs into the selected/unselected state I need a non-empty selection indices array. But I really do want an empty selection indices array so that all points from one datasource appear unselected.

I tried this hack where I add a selected index outside of the range of allowed indices. I don't have much javascript experience and I'm not sure what kind of problems that could cause. It does work for one datasource but for some reason I'm not seeing it doesn't work for the other one. I'd appreciate better suggestions. Maybe I could temporarily change the normal glyph to the nonselection_glyph?

Cheers,
Brian

import numpy as np
import pandas
from bokeh.plotting import output_file, show, Figure, curdoc
from bokeh.models import BoxSelectTool, ColumnDataSource, Circle, Square, CustomJS
from bokeh.io import output_server

output_server()

# random data points
N = 100
max = 100

x1 = np.random.random(size=N) * max
y1 = np.random.random(size=N) * max
df = pandas.DataFrame(data=dict({'x1':x1, 'y1':y1}))

# by some criteria, I want to plot some points as circles and some as squares
src_circ = ColumnDataSource(data=df[df['y1']<50.])
src_sqr = ColumnDataSource(data=df[df['y1']>=50.])

f = Figure(plot_width = 400, plot_height = 400, x_range = (0,max), y_range = (0,max))
m1 = f.circle(x='x1', y='y1', source=src_circ, color="blue")
m2 = f.square(x='x1', y='y1', source=src_sqr, color="red")
f.add_tools(BoxSelectTool())

m1.selection_glyph = Circle(fill_alpha=1, fill_color="green", line_color=None)
m1.nonselection_glyph = Circle(fill_alpha=0.2, fill_color="purple", line_color=None)

m2.selection_glyph = Square(fill_alpha=1, fill_color="orange", line_color=None)
m2.nonselection_glyph = Square(fill_alpha=0.2, fill_color="yellow", line_color=None)

# now, if I select only some squares, the circles turn purple
src_sqr.callback = CustomJS(args=dict(s2=src_circ), code="""
        var s1_inds = cb_obj.get('selected')['1d'].indices;
        var s2_inds = s2.get('selected')['1d'].indices;
        if(s1_inds.length > 0 && s2_inds.length == 0) {
          s2.get('selected')['1d'].indices = [s2.get('data')['y1'].length];
        }
    """)

# but, if I select only some circles, the squares still all stay red
src_circ.callback = CustomJS(args=dict(s2=src_sqr), code="""
        var s1_inds = cb_obj.get('selected')['1d'].indices;
        var s2_inds = s2.get('selected')['1d'].indices;
        if(s1_inds.length > 0 && s2_inds.length == 0) {
          s2.get('selected')['1d'].indices = [s2.get('data')['y1'].length];
        }
    """)

curdoc().add_root(f)
show(curdoc())

--
You received this message because you are subscribed to the Google Groups "Bokeh Discussion - Public" group.
To unsubscribe from this group and stop receiving emails from it, send an email to [email protected].
To post to this group, send email to [email protected].
To view this discussion on the web visit https://groups.google.com/a/continuum.io/d/msgid/bokeh/14f8dce6-14c3-44de-9ee5-587fb30b9092%40continuum.io\.
For more options, visit https://groups.google.com/a/continuum.io/d/optout\.