Color issue with multiple subplots

The following small example shows a problem with color arrays passed to different subplots. The first subplot is colored with the color array of the second subplot.

from bokeh.plotting import figure, output_notebook, gridplot, show
from bokeh.models import ColumnDataSource
import pandas as pd

df = pd.DataFrame({‘x’:[1,2,3],‘y’:[1,2,3]})

datasource = ColumnDataSource(df)

p1 = figure(plot_width=300, plot_height=300)
r1 = p1.circle(‘x’,‘y’,source=datasource,color=[‘green’,‘blue’,‘green’],size=20)

p2 = figure(plot_width=300, plot_height=300)
#r2 = p2.circle(‘x’,‘y’,source=datasource,color=“blue”,size=20)
r2 = p2.circle(‘x’,‘y’,source=datasource,color=[‘yellow’,‘red’,‘yellow’],size=20)

output_notebook()
p = gridplot([[p1],[p2]])
show(p)

``

Note: bokeh.version : ‘0.11.0’
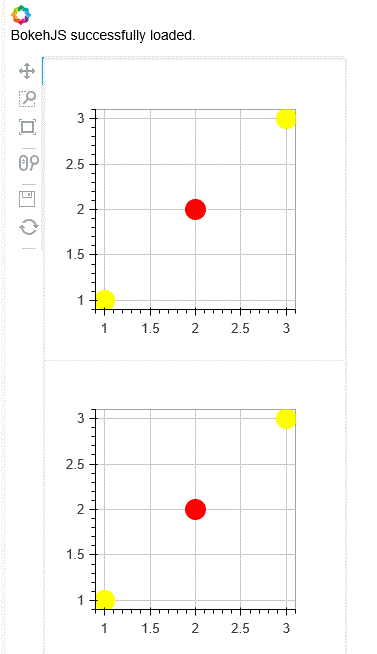
There’s only one data source and you have overwritten the color column. You’ll have you make two differently named columns explicitly for the colors in your data source, and set the “color” spec to that column.

Bryan

···

On Jan 10, 2016, at 18:46, Erwin Kalvelagen [email protected] wrote:

The following small example shows a problem with color arrays passed to different subplots. The first subplot is colored with the color array of the second subplot.

from bokeh.plotting import figure, output_notebook, gridplot, show
from bokeh.models import ColumnDataSource
import pandas as pd

df = pd.DataFrame({‘x’:[1,2,3],‘y’:[1,2,3]})

datasource = ColumnDataSource(df)

p1 = figure(plot_width=300, plot_height=300)
r1 = p1.circle(‘x’,‘y’,source=datasource,color=[‘green’,‘blue’,‘green’],size=20)

p2 = figure(plot_width=300, plot_height=300)
#r2 = p2.circle(‘x’,‘y’,source=datasource,color=“blue”,size=20)
r2 = p2.circle(‘x’,‘y’,source=datasource,color=[‘yellow’,‘red’,‘yellow’],size=20)

output_notebook()
p = gridplot([[p1],[p2]])
show(p)

``

Note: bokeh.version : ‘0.11.0’
You received this message because you are subscribed to the Google Groups “Bokeh Discussion - Public” group.

To unsubscribe from this group and stop receiving emails from it, send an email to [email protected].

To post to this group, send email to [email protected].

To view this discussion on the web visit https://groups.google.com/a/continuum.io/d/msgid/bokeh/3e4a8451-03da-4fa6-88c9-6ca0e3e51feb%40continuum.io.

For more options, visit https://groups.google.com/a/continuum.io/d/optout.

Thanks! That explains the behavior.

···

On Sunday, January 10, 2016 at 7:50:23 PM UTC-5, Bryan Van de ven wrote:

There’s only one data source and you have overwritten the color column. You’ll have you make two differently named columns explicitly for the colors in your data source, and set the “color” spec to that column.

Bryan

On Jan 10, 2016, at 18:46, Erwin Kalvelagen [email protected] wrote:

The following small example shows a problem with color arrays passed to different subplots. The first subplot is colored with the color array of the second subplot.

from bokeh.plotting import figure, output_notebook, gridplot, show
from bokeh.models import ColumnDataSource
import pandas as pd

df = pd.DataFrame({‘x’:[1,2,3],‘y’:[1,2,3]})

datasource = ColumnDataSource(df)

p1 = figure(plot_width=300, plot_height=300)
r1 = p1.circle(‘x’,‘y’,source=datasource,color=[‘green’,‘blue’,‘green’],size=20)

p2 = figure(plot_width=300, plot_height=300)
#r2 = p2.circle(‘x’,‘y’,source=datasource,color=“blue”,size=20)
r2 = p2.circle(‘x’,‘y’,source=datasource,color=[‘yellow’,‘red’,‘yellow’],size=20)

output_notebook()
p = gridplot([[p1],[p2]])
show(p)

``

Note: bokeh.version : ‘0.11.0’

You received this message because you are subscribed to the Google Groups “Bokeh Discussion - Public” group.

To unsubscribe from this group and stop receiving emails from it, send an email to [email protected].

To post to this group, send email to [email protected].

To view this discussion on the web visit https://groups.google.com/a/continuum.io/d/msgid/bokeh/3e4a8451-03da-4fa6-88c9-6ca0e3e51feb%40continuum.io.

For more options, visit https://groups.google.com/a/continuum.io/d/optout.

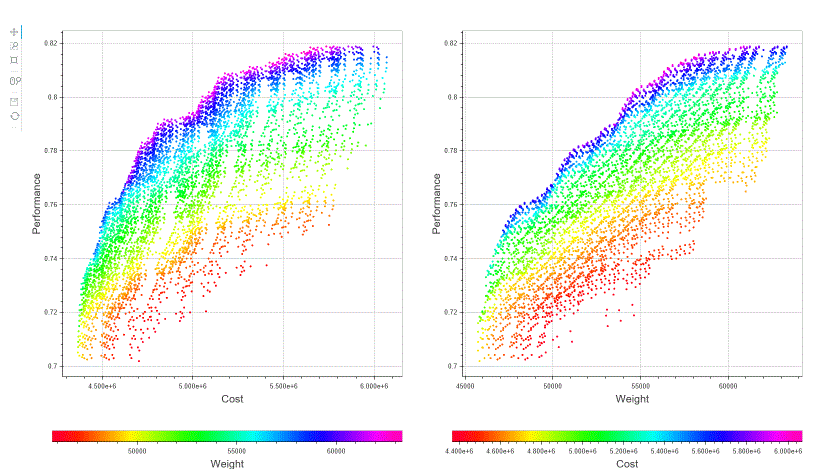
Now I can do:

Looks very pretty. It would be great if we can do the colorbar in a more automatic fashion (I implemented this as a separate figure).

Erwin

···

On Sunday, January 10, 2016 at 8:29:17 PM UTC-5, Erwin Kalvelagen wrote:

Thanks! That explains the behavior.

On Sunday, January 10, 2016 at 7:50:23 PM UTC-5, Bryan Van de ven wrote:

There’s only one data source and you have overwritten the color column. You’ll have you make two differently named columns explicitly for the colors in your data source, and set the “color” spec to that column.

Bryan

On Jan 10, 2016, at 18:46, Erwin Kalvelagen [email protected] wrote:

The following small example shows a problem with color arrays passed to different subplots. The first subplot is colored with the color array of the second subplot.

from bokeh.plotting import figure, output_notebook, gridplot, show
from bokeh.models import ColumnDataSource
import pandas as pd

df = pd.DataFrame({‘x’:[1,2,3],‘y’:[1,2,3]})

datasource = ColumnDataSource(df)

p1 = figure(plot_width=300, plot_height=300)
r1 = p1.circle(‘x’,‘y’,source=datasource,color=[‘green’,‘blue’,‘green’],size=20)

p2 = figure(plot_width=300, plot_height=300)
#r2 = p2.circle(‘x’,‘y’,source=datasource,color=“blue”,size=20)
r2 = p2.circle(‘x’,‘y’,source=datasource,color=[‘yellow’,‘red’,‘yellow’],size=20)

output_notebook()
p = gridplot([[p1],[p2]])
show(p)

``

Note: bokeh.version : ‘0.11.0’

You received this message because you are subscribed to the Google Groups “Bokeh Discussion - Public” group.

To unsubscribe from this group and stop receiving emails from it, send an email to [email protected].

To post to this group, send email to [email protected].

To view this discussion on the web visit https://groups.google.com/a/continuum.io/d/msgid/bokeh/3e4a8451-03da-4fa6-88c9-6ca0e3e51feb%40continuum.io.

For more options, visit https://groups.google.com/a/continuum.io/d/optout.