when i add colorbar to plot, i find the ticker always be unexpected. even if i use fixedticker, the situation has not improved. My code is similar to the example from Heat Map . the form of main code as following:
...
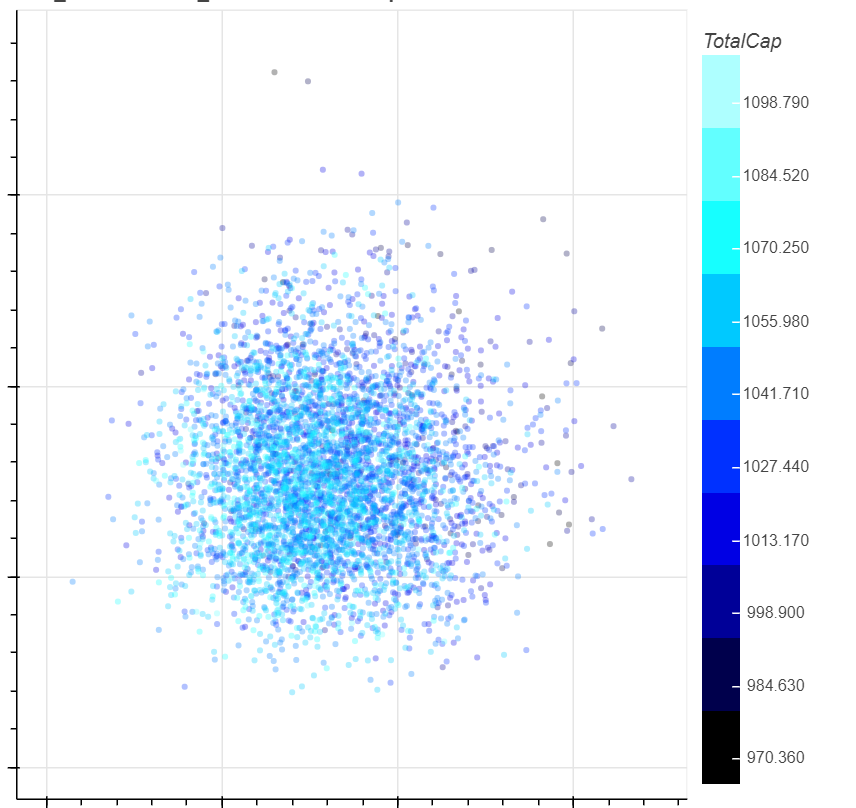
ticklist = [970.36, 984.63, 998.9, 1013.17, 1027.44, 1041.71, 1055.98, 1070.25, 1084.52, 1098.79, 1113.06]
fixticker = FixedTicker(ticks=ticklist)
color_bar = ColorBar(color_mapper=mapper, location=(0, 0), title=columns[i][2], margin=12, ticker=fT, label_standoff=12, formatter=PrintfTickFormatter(format="%.3f"))
...
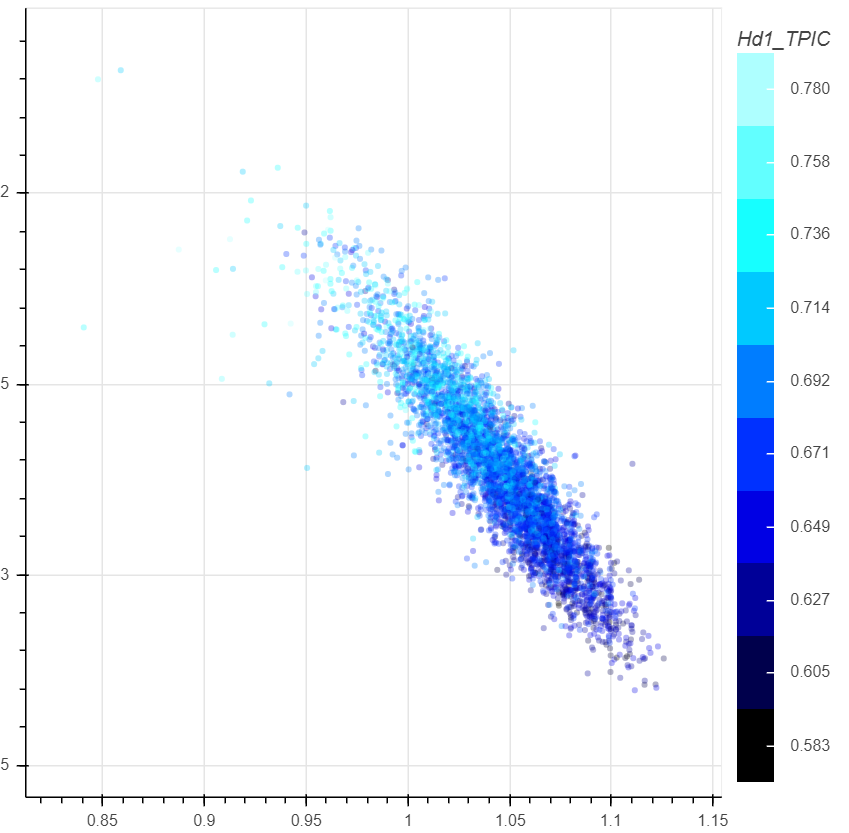
here are the output.
this one seems ok.
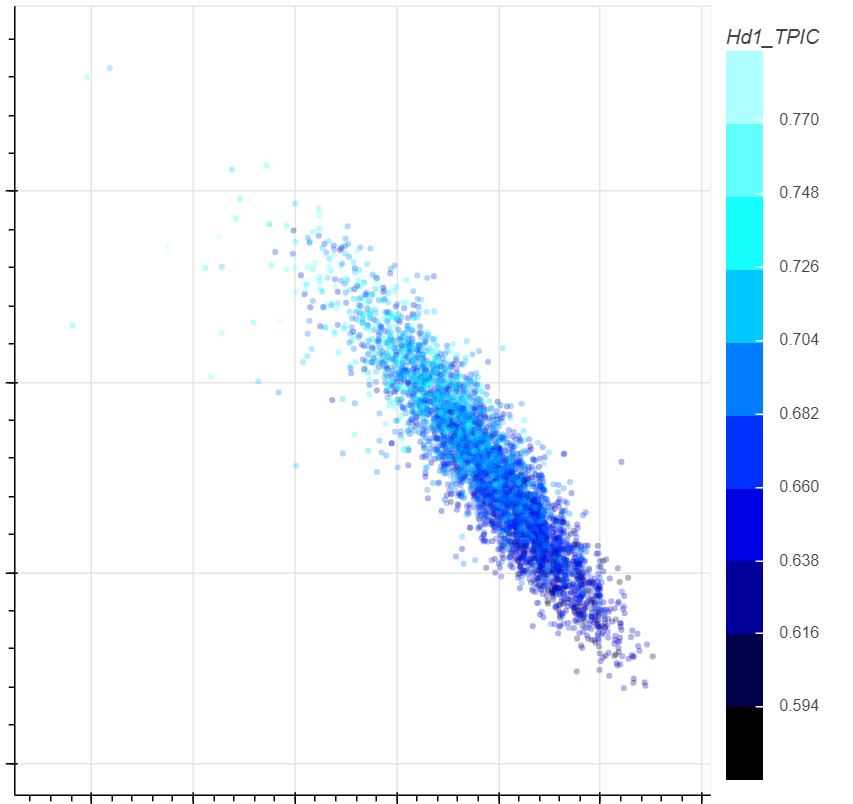
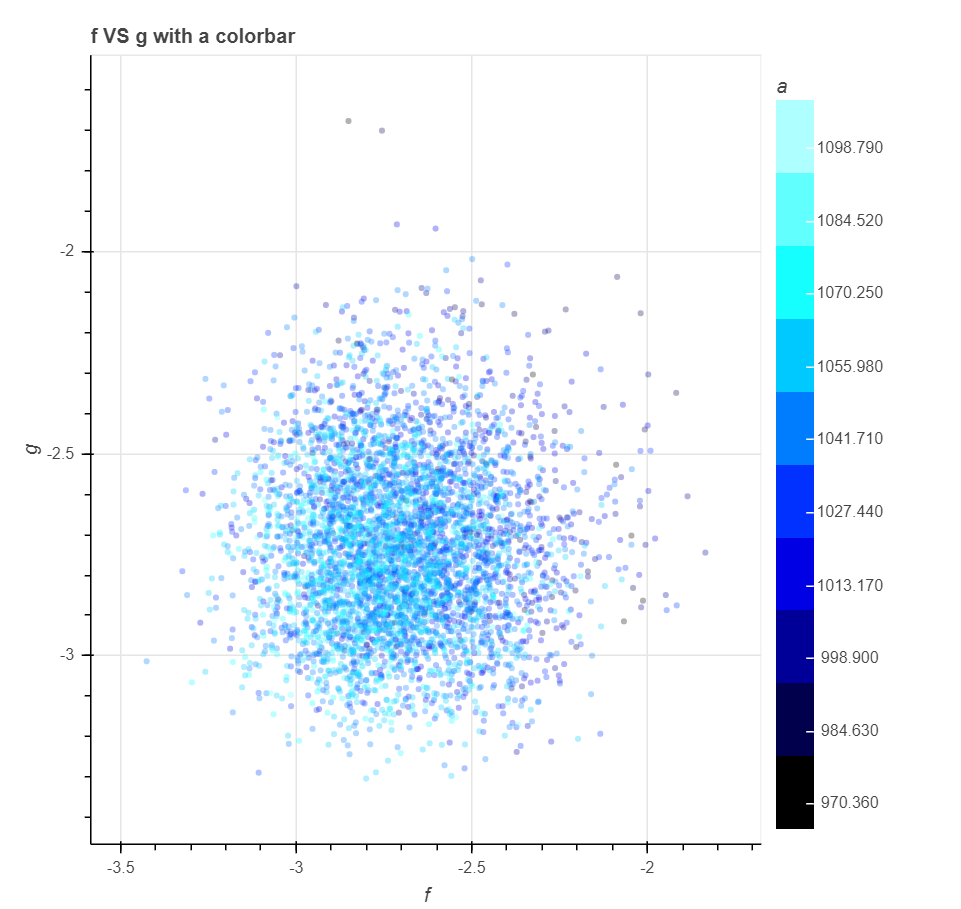
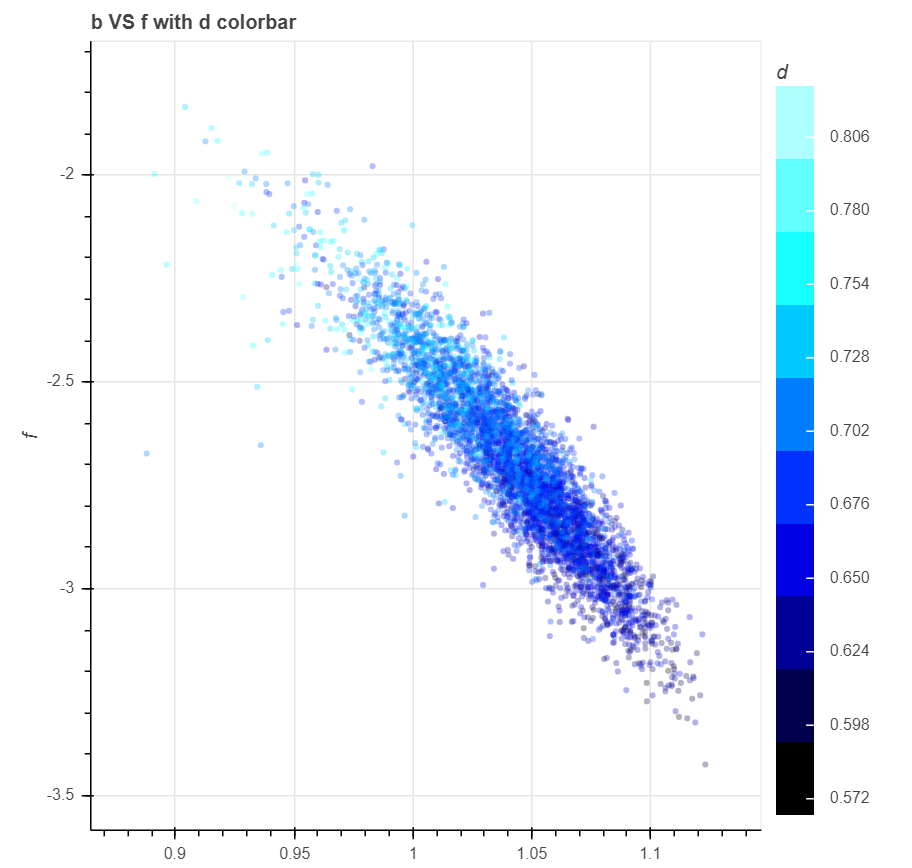
but this one doesn’t.
pls help me. thanks.
this one seems ok.
but this one doesn’t.
It doesn’t really tell us what you want. Do you want the values to be in the middle of the separate color bar sections?
Can you provide a complete example that generates those images?
If not, can you at least show how you created the mapper?
1 Like
Sorry about that. I’m not familiar with English, so it’s a challenge fro me to express me in English.
On one hand I want the values to be in the middle of the separate color bar sections, on the other hand I want the ticks can be exactly shown, no more and no less.
The first meets my requirements, but the second and the third not, because the number of ticks of the third is 9 instead of 10 I expected, and the the values in the second are not in the middle of the separate colorbar section.
Method of creating color bar:
def my_palettes(n):
    # max=256*3-1 [0,max)
    max_num = 256*3-1
    step = max_num//n
    colors = []
    for i in range(0, n*step, step):
        t = i
        after = ''
        if (i > 255) and (i < 511):
            t = t-255
            after = 'ff'
        if i > 510:
            t = t - 510
            after = 'ffff'
        s = str(hex(t)).split('x')[-1] + after
        colors.append(s)
    for i in range(len(colors)):
        i_len = len(colors[i])
        colors[i] = '#' + '0'*(6-i_len) + colors[i]
    return colors


def my_draw():
        '''some code'''
        colors = my_palettes(color_n)
        low, high = file[columns[i][2]].min(), file[columns[i][2]].max()
        mapper = LinearColorMapper(palette=colors, low=low, high=high)
        '''some code'''
        ticks = np.linspace(low, high, color_n).tolist()
        fT = FixedTicker(ticks=ticks)
        color_bar = ColorBar(color_mapper=mapper, location=(0, 0), title=columns[i][2], margin=12, ticker=fT,
                             label_standoff=12, formatter=PrintfTickFormatter(format="%.3f"))
         ''' some code'''
Thanks, sincerely.
Your English is just fine, don’t worry about at.
Since you want to provide ticks that are positioned in the middle of the colored section, you have to shift them by half of the height of a section, that’s it.
step_height = (high - low) / color_n
ticks = np.linspace(low + step_height / 2, high - step_height / 2, color_n).tolist()
1 Like
Wow! Excellent. You are right. The output is exactly I expected.
Thanks very much. Nice to meet you, ‘DaLao’.