Hi everyone!
I’m creating an heatmap but I’m having problems with the color bar ticks: I have in my example 7 colours with 7 tick labels but those ticks are not in the center of the color cell:
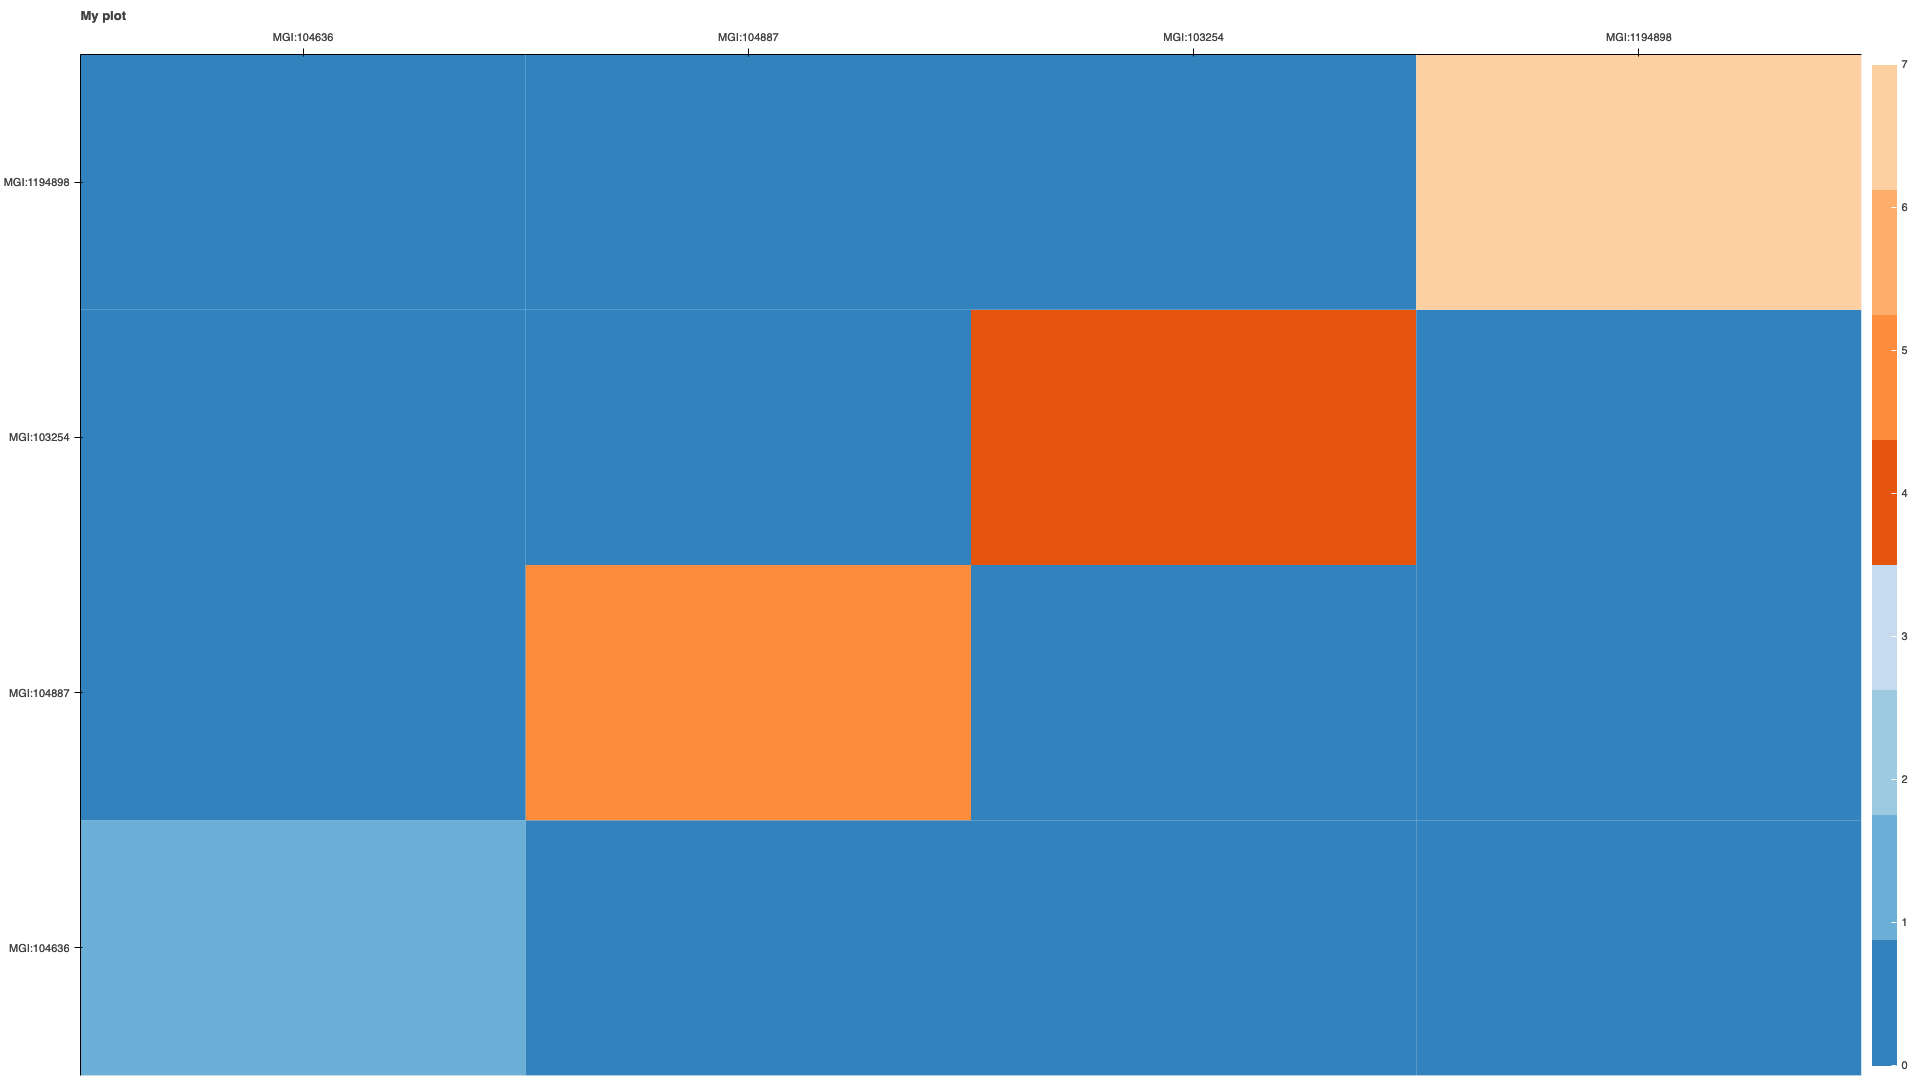
Is it possible to move the ticks to be centered?
Here’s my code:
colors = bokeh.palettes.Category20c_20[0:df.value.max()+1]
mapper = LinearColorMapper(palette=colors, low=df.value.min(), high=df.value.max())


p = figure(
    plot_width=1920,
    plot_height=1080,
    title="Heatmap",
    x_range=list(df.MGI_id.drop_duplicates()),
    y_range=list(df.MGI_id_col.drop_duplicates()),
    toolbar_location=None,
    tools="",
    x_axis_location="above")

p.rect(
    x="MGI_id",
    y="MGI_id_col",
    width=1,
    height=1,
    source=ColumnDataSource(df),
    line_color=None,
    fill_color=transform('value', mapper))

color_bar = ColorBar(color_mapper=mapper, location=(0, 0), ticker=BasicTicker(desired_num_ticks=len(colors)))

p.add_layout(color_bar, 'right')