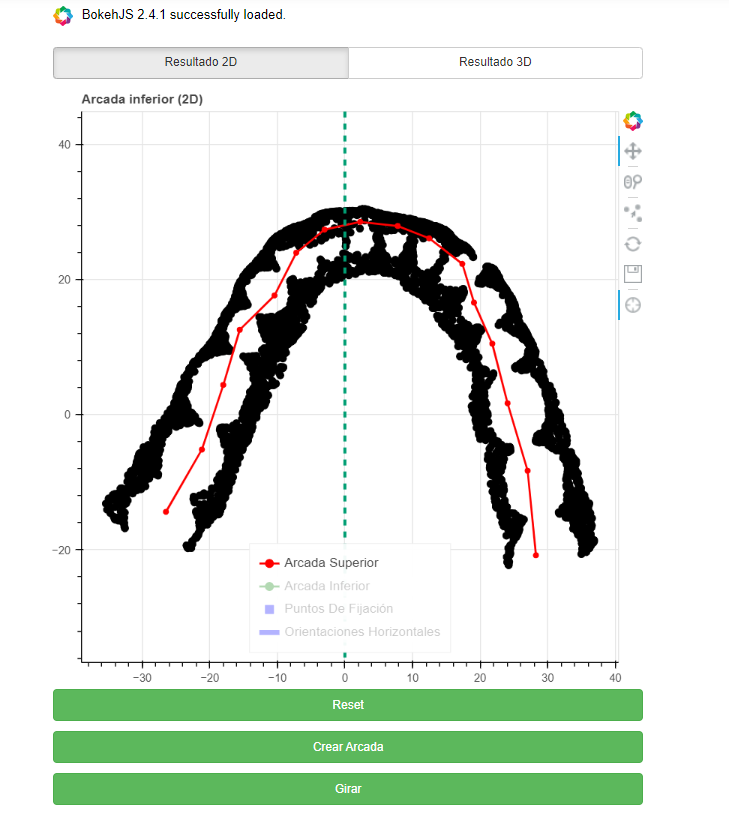
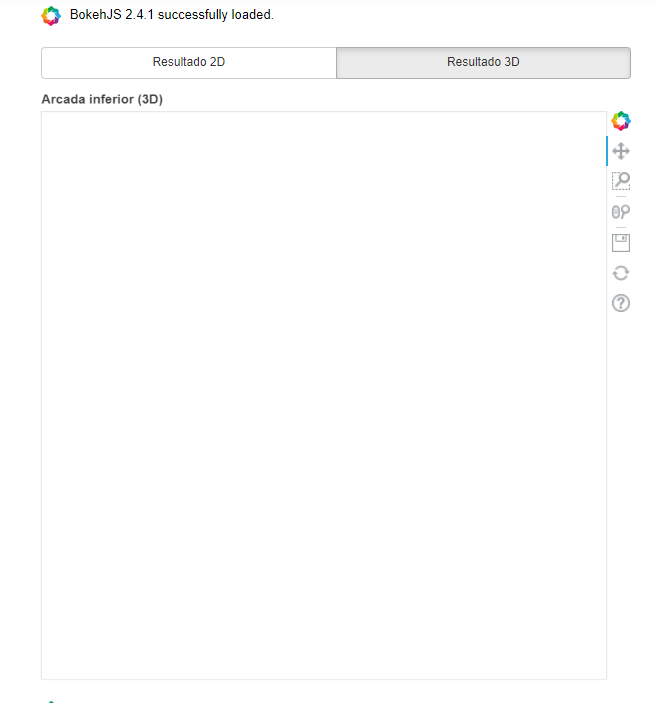
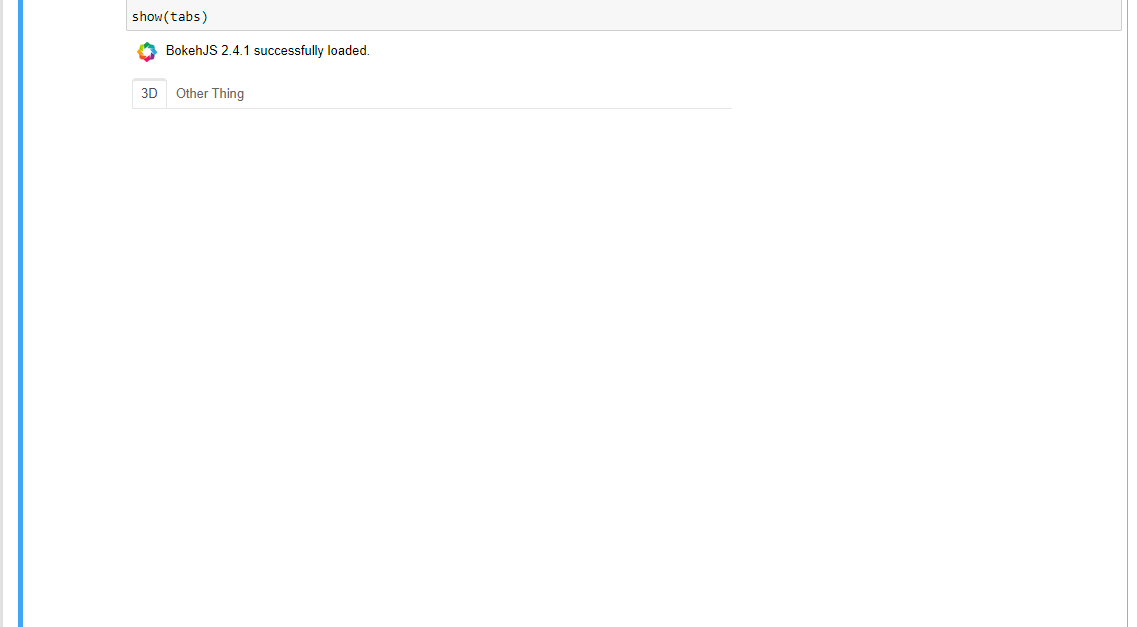
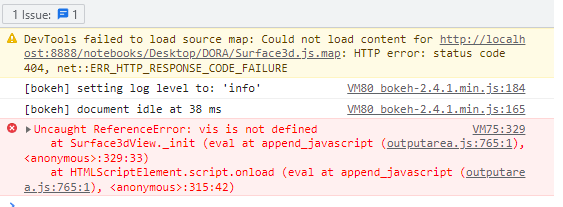
Awesome!!!, this is exactly what i need  , but when i copy the example in a new jupyter cell it shows a white plot
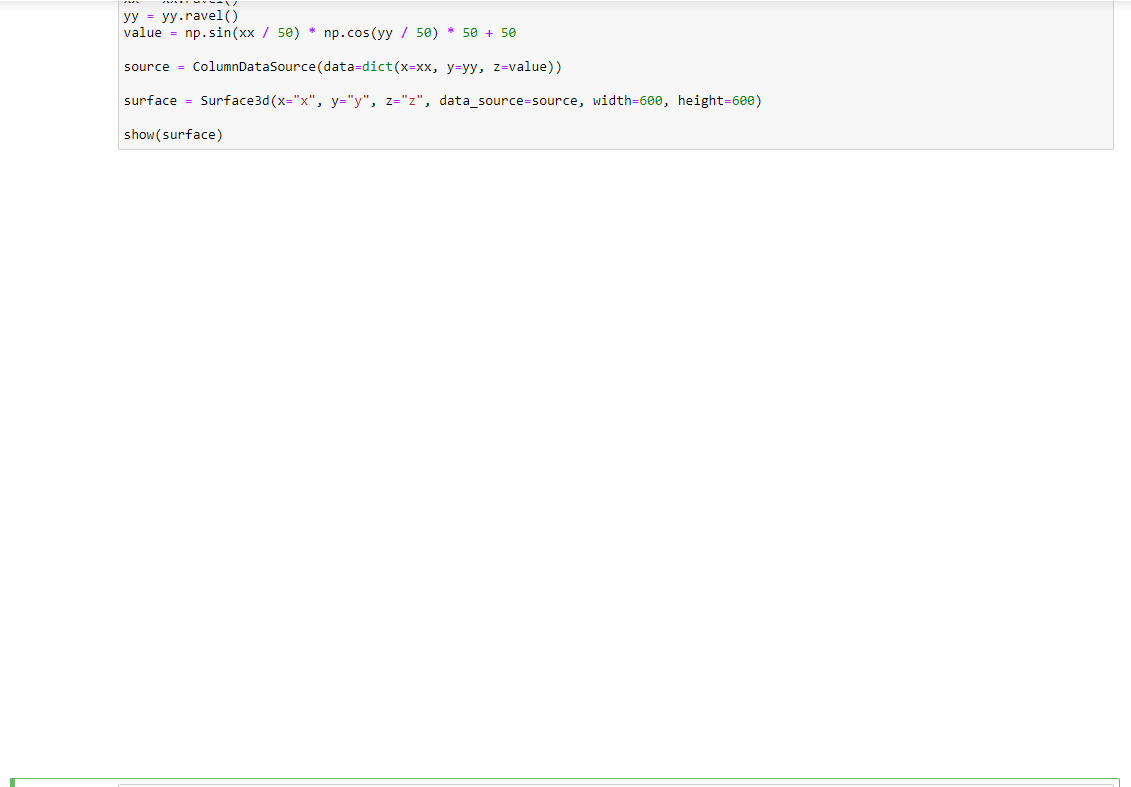
The code i got is this one, no more cells have been ran:
import numpy as np
import bokeh
from bokeh.core.properties import Instance, String
from bokeh.io import show
from bokeh.models import ColumnDataSource, LayoutDOM
from bokeh.util.compiler import TypeScript
TS_CODE = """
// This custom model wraps one part of the third-party vis.js library:
//
// http://visjs.org/index.html
//
// Making it easy to hook up python data analytics tools (NumPy, SciPy,
// Pandas, etc.) to web presentations using the Bokeh server.
import {LayoutDOM, LayoutDOMView} from "models/layouts/layout_dom"
import {ColumnDataSource} from "models/sources/column_data_source"
import {LayoutItem} from "core/layout"
import * as p from "core/properties"
declare namespace vis {
class Graph3d {
constructor(el: HTMLElement, data: object, OPTIONS: object)
setData(data: vis.DataSet): void
}
class DataSet {
add(data: unknown): void
}
}
// This defines some default options for the Graph3d feature of vis.js
// See: http://visjs.org/graph3d_examples.html for more details.
const OPTIONS = {
width: '600px',
height: '600px',
style: 'surface',
showPerspective: true,
showGrid: true,
keepAspectRatio: true,
verticalRatio: 1.0,
legendLabel: 'stuff',
cameraPosition: {
horizontal: -0.35,
vertical: 0.22,
distance: 1.8,
},
}
// To create custom model extensions that will render on to the HTML canvas
// or into the DOM, we must create a View subclass for the model.
//
// In this case we will subclass from the existing BokehJS ``LayoutDOMView``
export class Surface3dView extends LayoutDOMView {
model: Surface3d
private _graph: vis.Graph3d
initialize(): void {
super.initialize()
const url = "https://cdnjs.cloudflare.com/ajax/libs/vis/4.16.1/vis.min.js"
const script = document.createElement("script")
script.onload = () => this._init()
script.async = false
script.src = url
document.head.appendChild(script)
}
private _init(): void {
// Create a new Graph3s using the vis.js API. This assumes the vis.js has
// already been loaded (e.g. in a custom app template). In the future Bokeh
// models will be able to specify and load external scripts automatically.
//
// BokehJS Views create <div> elements by default, accessible as this.el.
// Many Bokeh views ignore this default <div>, and instead do things like
// draw to the HTML canvas. In this case though, we use the <div> to attach
// a Graph3d to the DOM.
this._graph = new vis.Graph3d(this.el, this.get_data(), OPTIONS)
// Set a listener so that when the Bokeh data source has a change
// event, we can process the new data
this.connect(this.model.data_source.change, () => {
this._graph.setData(this.get_data())
})
}
// This is the callback executed when the Bokeh data has an change. Its basic
// function is to adapt the Bokeh data source to the vis.js DataSet format.
get_data(): vis.DataSet {
const data = new vis.DataSet()
const source = this.model.data_source
for (let i = 0; i < source.get_length()!; i++) {
data.add({
x: source.data[this.model.x][i],
y: source.data[this.model.y][i],
z: source.data[this.model.z][i],
})
}
return data
}
get child_models(): LayoutDOM[] {
return []
}
_update_layout(): void {
this.layout = new LayoutItem()
this.layout.set_sizing(this.box_sizing())
}
}
// We must also create a corresponding JavaScript BokehJS model subclass to
// correspond to the python Bokeh model subclass. In this case, since we want
// an element that can position itself in the DOM according to a Bokeh layout,
// we subclass from ``LayoutDOM``
export namespace Surface3d {
export type Attrs = p.AttrsOf<Props>
export type Props = LayoutDOM.Props & {
x: p.Property<string>
y: p.Property<string>
z: p.Property<string>
data_source: p.Property<ColumnDataSource>
}
}
export interface Surface3d extends Surface3d.Attrs {}
export class Surface3d extends LayoutDOM {
properties: Surface3d.Props
__view_type__: Surface3dView
constructor(attrs?: Partial<Surface3d.Attrs>) {
super(attrs)
}
// The ``__name__`` class attribute should generally match exactly the name
// of the corresponding Python class. Note that if using TypeScript, this
// will be automatically filled in during compilation, so except in some
// special cases, this shouldn't be generally included manually, to avoid
// typos, which would prohibit serialization/deserialization of this model.
static __name__ = "Surface3d"
static {
// This is usually boilerplate. In some cases there may not be a view.
this.prototype.default_view = Surface3dView
// The @define block adds corresponding "properties" to the JS model. These
// should basically line up 1-1 with the Python model class. Most property
// types have counterparts, e.g. ``bokeh.core.properties.String`` will be
// ``String`` in the JS implementatin. Where the JS type system is not yet
// as rich, you can use ``p.Any`` as a "wildcard" property type.
this.define<Surface3d.Props>(({String, Ref}) => ({
x: [ String ],
y: [ String ],
z: [ String ],
data_source: [ Ref(ColumnDataSource) ],
}))
}
}
"""
# This custom extension model will have a DOM view that should layout-able in
# Bokeh layouts, so use ``LayoutDOM`` as the base class. If you wanted to create
# a custom tool, you could inherit from ``Tool``, or from ``Glyph`` if you
# wanted to create a custom glyph, etc.
class Surface3d(LayoutDOM):
# The special class attribute ``__implementation__`` should contain a string
# of JavaScript code that implements the browser side of the extension model.
__implementation__ = TypeScript(TS_CODE)
# Below are all the "properties" for this model. Bokeh properties are
# class attributes that define the fields (and their types) that can be
# communicated automatically between Python and the browser. Properties
# also support type validation. More information about properties in
# can be found here:
#
# https://docs.bokeh.org/en/latest/docs/reference/core/properties.html#bokeh-core-properties
# This is a Bokeh ColumnDataSource that can be updated in the Bokeh
# server by Python code
data_source = Instance(ColumnDataSource)
# The vis.js library that we are wrapping expects data for x, y, and z.
# The data will actually be stored in the ColumnDataSource, but these
# properties let us specify the *name* of the column that should be
# used for each field.
x = String()
y = String()
z = String()
x = np.arange(0, 300, 10)
y = np.arange(0, 300, 10)
xx, yy = np.meshgrid(x, y)
xx = xx.ravel()
yy = yy.ravel()
value = np.sin(xx / 50) * np.cos(yy / 50) * 50 + 50
source = ColumnDataSource(data=dict(x=xx, y=yy, z=value))
bokeh.io.output_notebook()
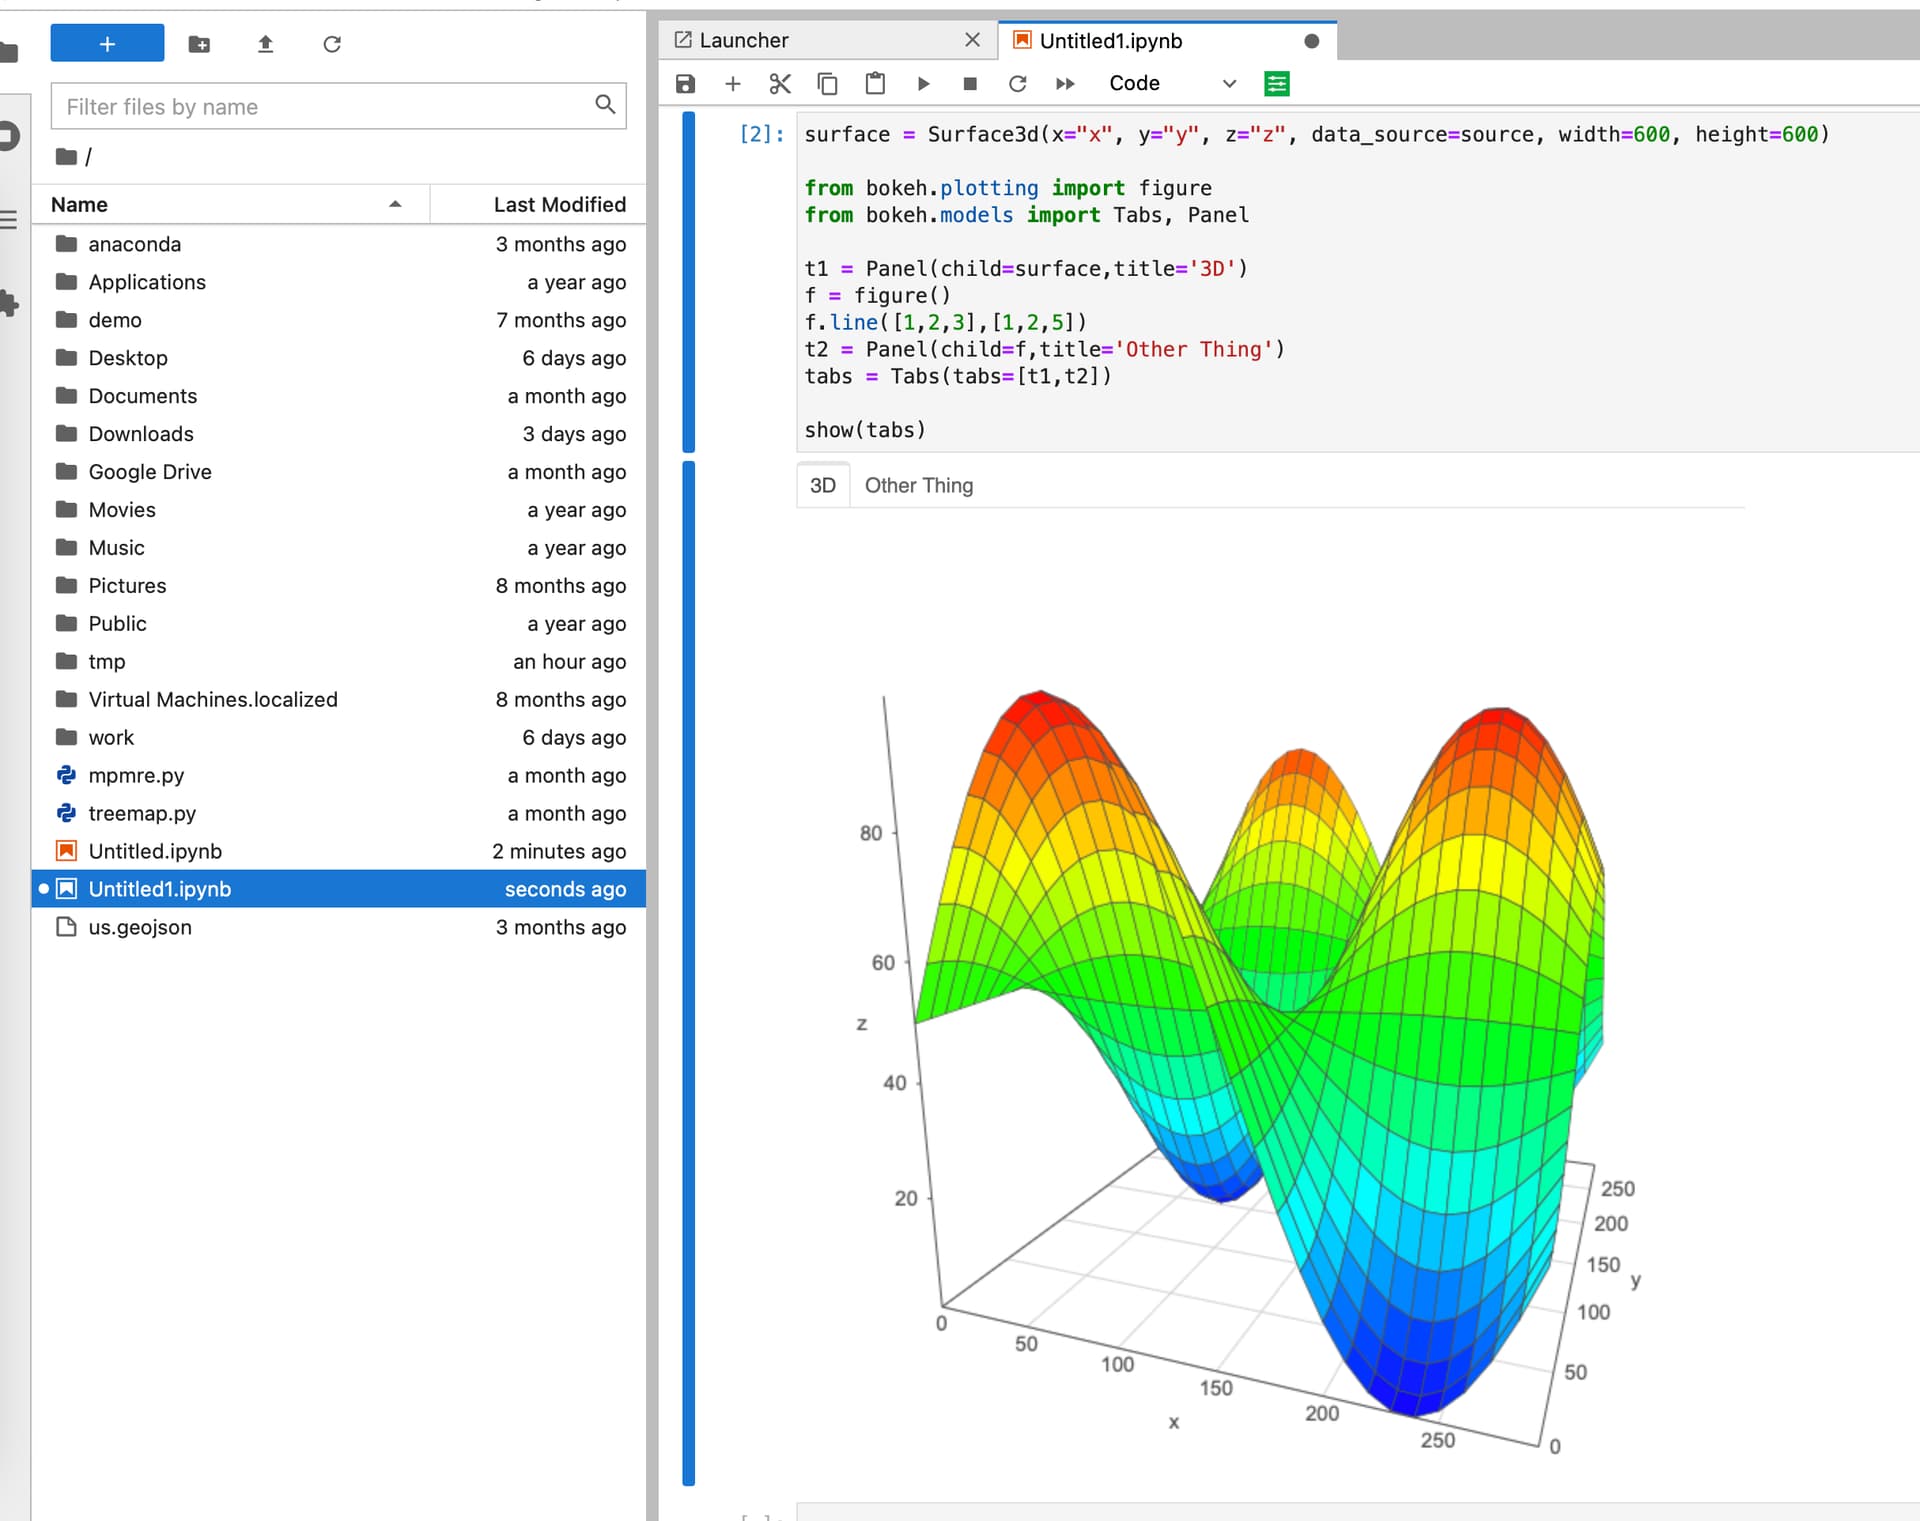
surface = Surface3d(x="x", y="y", z="z", data_source=source, width=600, height=600)
from bokeh.plotting import figure
from bokeh.models import Tabs, Panel

t1 = Panel(child=surface,title='3D')
f = figure()
f.line([1,2,3],[1,2,5])
t2 = Panel(child=f,title='Other Thing')
tabs = Tabs(tabs=[t1,t2])

show(tabs)