I saw release 2.4.0 and this particular issue was of interest to me,
#7217 [component: bokehjs] Including both log and linear axis types not working
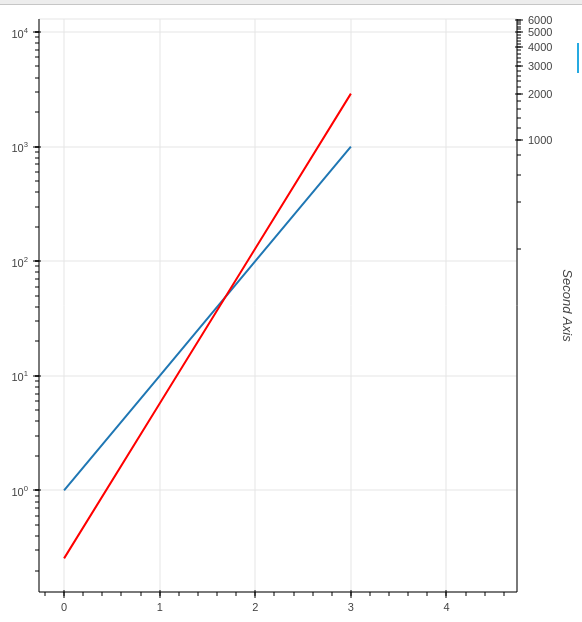
However I don’t get the expected result.
This is the test code,
from bokeh.layouts import layout, column
from bokeh.models import LinearAxis, Range1d
from bokeh.plotting import figure
from bokeh.io import show

source = {"t": [0,  1,   2,    3],
          "i": [1, 10, 100, 1000],
          "v": [2, 20, 200, 2000]
}

f = figure(y_range=(0.1, 10000), x_range=(0, 5), y_axis_type="log")

log_line = f.line(x="t", y="i", line_width=2, source=source)

f.extra_y_ranges['Second Axis'] = Range1d(start=0, end=5000)
axis = LinearAxis(y_range_name='Second Axis', axis_label='Second Axis')
f.add_layout(axis, 'right')

lin_line = f.line(x="t", y="v", line_width=2, source=source, y_range_name="Second Axis", color="red")

doc_layout = layout()
doc_layout.children.append(column(f))
show(doc_layout)
Bryan
September 16, 2021, 7:44pm
2
@Martin_Guthrie Always advised to follow through to the actual PR that closes and issue, since that will have whatever the eventual solution was (as opposed to the issue, that just has whatever was initially reported and may not represent the final outcome).
bokeh:branch-2.4 ← bokeh:mattpap/7217_log_and_linear_axes
opened 04:46PM - 07 Mar 21 UTC
Proof of concept. I don't expect this to be merged as-is, because this should be… handled via sub-coordinates, for which I need to finally expose an API.
Example:
```py
from bokeh.models import LinearAxis, LinearScale, Range1d
from bokeh.plotting import figure
from bokeh.io import save
source = {"t": [0, 1, 2, 3],
"i": [1, 10, 100, 1000],
"v": [2, 20, 200, 2000]
}
f = figure(y_range=(0.1, 10000), x_range=(0, 5), y_axis_type="log")
log_line = f.line(x="t", y="i", line_width=2, source=source)
f.extra_y_ranges = {"V": Range1d(start=0, end=5000)}
f.extra_y_scales = {"V": LinearScale()}
f.add_layout(LinearAxis(y_range_name="V", axis_label="Linear"), 'left')
lin_line = f.line(x="t", y="v", line_width=2, source=source, y_range_name="V", color="red")
save(f)
```
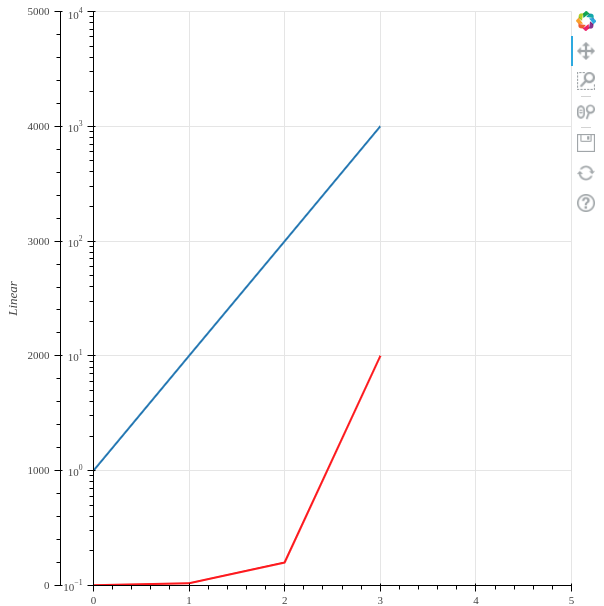
fixes #7217
in particular there is a complete Python example added in that PR, that demonstrates how you will also need to add the appropriate additional scales to the plot:
from bokeh.io import show
from bokeh.models import LinearAxis, LinearScale, Range1d
from bokeh.plotting import figure

source = {
    "t": [0,  1,   2,    3,     4],
    "v": [1, 10, 100, 1000, 10000],
}

f = figure(y_axis_type="log")

f.yaxis.axis_label = "Log"
f.yaxis.axis_label_text_color = "blue"

f.extra_y_ranges = {"linear": Range1d(-1000, 20000)}
f.extra_y_scales = {"linear": LinearScale()}

ax = LinearAxis(y_range_name="linear", axis_label="Linear", axis_label_text_color="red")
f.add_layout(ax, "left")
show original
1 Like
Indeed, I missed the example.
BTW, I put a bounty on that issue, and I would love to see someone from the team collect!
bokeh/bokeh
2 Likes
Bryan
September 17, 2021, 4:08am
4
The work was performed by @mateusz I will be sure to pass the link along to him!
1 Like
system
December 16, 2021, 4:09am
5
This topic was automatically closed 90 days after the last reply. New replies are no longer allowed.