import bokeh
from bokeh.plotting import figure,show
from bokeh.io import output_notebook,output_file
from bokeh.models import CategoricalColorMapper
output_notebook()
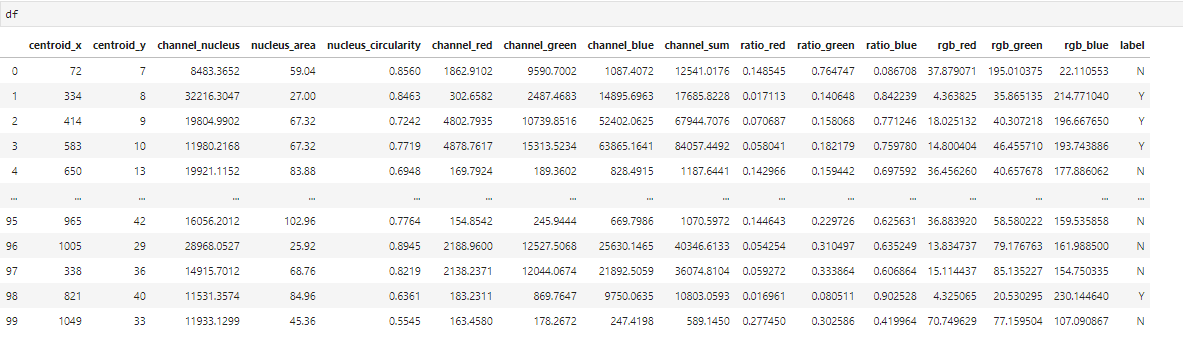
X = df.shape[0]
X = list(map(str, list(range(X))))
channels = ['red', 'green', 'blue']
#list colour_background and colour_filter values to be used with filtering by boolean expression
colour_background = ['#590000','#004600','#000050']
colour_filter = ['#FF0000','#00FF00','#0000FF']
data = {'X' : X,
'red' : df['ratio_red'],
'green' : df['ratio_green'],
'blue' : df['ratio_blue']}
p = figure(x_range=X, plot_height=400,plot_width = 12000, title='cell channel ratios',tools="hover", tooltips="$name @X: @$name")
p.vbar_stack(channels, x='X', width=0.7, color=colour_filter, source=data,line_color='black', line_width=0.1)
p.y_range.start = 0
p.y_range.end = 1
p.x_range.range_padding = 0
p.xaxis.visible = False
show(p)
Hello,
I want to create a stacked bar graph from the dataframe, but use the column [label] to set bar color, with [label] == ‘Y’ row values displayed with colors [’#FF0000’,’#00FF00’,’#0000FF’] and == ‘N’ row values displayed with colors [’#590000’,’#004600’,’#000050’].
The above code works fine for generating the stacked bars without this extra detail. So far I haven’t had any luck trying to add a condition plus ColorMapper function or defining the bar sections independently and then constructing each bar. Could you suggest a solution? Thanks