Hello all,
I am trying to produce an interactive plot in an html that filters data by a MultiChoice selection. I am essentially able to produce what I want in the following code with interactive legend options, but when I have too many inputs the plots get too messy.
import pandas as pd
import numpy as np

from bokeh.plotting import figure, show
from bokeh.models import ColumnDataSource, CustomJS

df = pd.DataFrame()
df['name'] = ['a','a','a','b','b','b','c','c','c']
df['sample'] =np.random.randint(1,3,9)
df['x'] = np.random.randint(0,10,9)
df['y'] = np.random.randint(0,10,9)

plot = figure(width=400, height=400)

for name in df.name.unique():

    source = ColumnDataSource(df[df['name']==name].groupby(['sample']).median())
    plot.circle('x', 'y', source=source, legend_label=name)

plot.legend.click_policy="hide"
plot.legend.background_fill_alpha = 0.25

show(plot)
I understand that in order to get the MultiChoice widget to reformat my plot I need to define a CustomJS callback. I have been a little stumped here as I am not familiar with JS. My attempt to get this to work is in the code below.
import pandas as pd
import numpy as np

from bokeh.plotting import figure, show
from bokeh.models import ColumnDataSource, CustomJS, MultiChoice
from bokeh.layouts import row

df = pd.DataFrame()
df['name'] = ['a','a','a','b','b','b','c','c','c']
df['sample'] =np.random.randint(1,3,9)
df['x'] = np.random.randint(0,10,9)
df['y'] = np.random.randint(0,10,9)

plot = figure(width=400, height=400)

source = ColumnDataSource(df)

# Set up MultiChoice widget
initial_value = [df.name[0]]
options = list(df.name.unique())
multi_choice = MultiChoice(value=initial_value, options=options, max_items=3, title='Selection:')

# dict append function
def set_key(dictionary, key, value):
    if type(dictionary[key]) == list:
        dictionary[key].append(value)
    else:
        dictionary[key] = [dictionary[key], value]

    return dictionary

# Create name dict for source
temp_choice_dict = {}
for name in df.name.unique():
    if name == 'a':
        choice_dict = {'name': name}
    else:
        temp_choice_dict = {'name': name}
    for key, value in temp_choice_dict.items():
            choice_dict=set_key(choice_dict,key,value)

source_name = ColumnDataSource(name_dict)

# Make plots from source data
if source_name.data['name']==[]:
    source_empty = ColumnDataSource({'x':[],'y':[]})
    plot.circle('x', 'y', source=source_empty)
else:
    for i in range(len(source_name.data['name'])):

        source = ColumnDataSource(df[df['name']==source_name.data['name'][i]].groupby(['sample']).median())
        plot.circle('x', 'y', source=source, legend_label=source_name.data['name'][i])

# Create JS callback
callback = CustomJS(args={'source_name':source_name},code="""
        console.log(' changed selected option', cb_obj.value);
        source_name.data['name'] = cb_obj.value;
        console.log(' source change', source_name.data['name']);
        source_name.change.emit();
""")


multi_choice.js_on_change('value', callback)

plot.legend.background_fill_alpha = 0.25

show(row(plot,multi_choice))
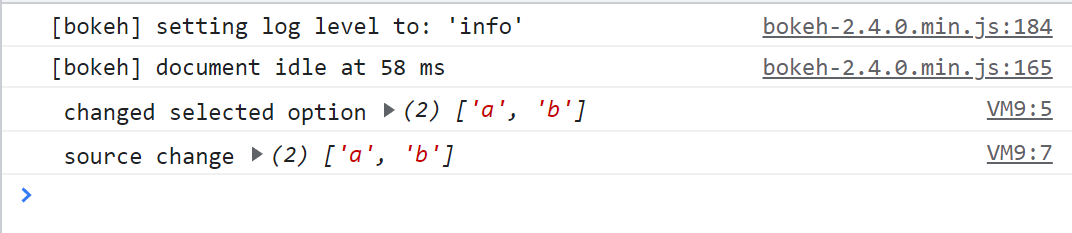
According to the console log the MultiChoice selections do update the source, but my plot does not update. Thanks in advance for anyone that can point me in the right direction.