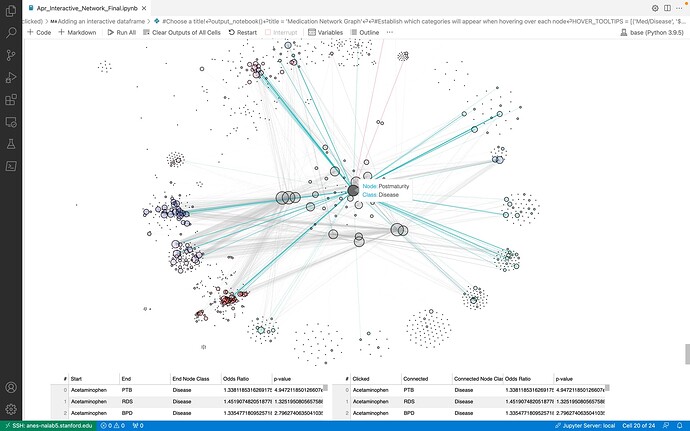
Hi everyone, I built a networkx graph which shows the odds ratio between medications and diseases. Before I finalize the graph, I’m trying to connect it to an interactive DataTable which highlight the properties of “clicked” nodes and connected nodes, edges. However, I am keep getting error message " TypeError: Object of type DataFrame is not JSON serializable"
Here is my complete code for the bokeh networkx:
### Choose a title!
output_notebook()
title = 'Medication Network Graph'

### Establish which categories will appear when hovering over each node
node_hover_tool = [('Node','@index'),('Class','@class')]

### Create a plot — set dimensions, toolbar, and title
plot = figure(tooltips = node_hover_tool, title=title,
              tools="pan,wheel_zoom,box_zoom,reset", toolbar_location="above",plot_width=1350,plot_height=2000) #x_range=(-2000, 1700), y_range=(-2000, 4000),xwheel_pan, ywheel_pan,
plot.add_tools(HoverTool(tooltips=node_hover_tool), TapTool(), BoxSelectTool())

### Add nodes and edges (1178 nodes - medications + diseases / 778 edges - odds ratio between medications and diseases)
G=nx.Graph()
G.add_nodes_from(node_list) # format: [(node, {size,color,pos,class}),(node2, {size,color,pos,class}),...]
G.add_edges_from(edge_list) # format: [(node,node2,{width,color,color_clicked}),(node4,node7,{width,color,color_clicked}),...]

edge_weight = [i['weight'] for i in dict(G.edges).values()]
edge_color = [i['color'] for i in dict(G.edges).values()]

fixed_nodes = node_dict.keys()
fixed_positions = nx.get_node_attributes(G,'pos')
node_sizes = nx.get_node_attributes(G,'size')
node_colors = nx.get_node_attributes(G,'color')

pos = nx.spring_layout(G,pos=fixed_positions)#,pos=fixed_positions, fixed = fixed_nodes
edge_width = nx.get_edge_attributes(G,'weight')
edge_color = nx.get_edge_attributes(G,'color')
edge_color_click=nx.get_edge_attributes(G,'color_clicked')


nx.set_node_attributes(G, node_colors, 'node_color')
nx.set_node_attributes(G, node_sizes, 'node_size')
nx.set_edge_attributes(G, edge_color, "edge_color")
nx.set_edge_attributes(G, edge_color_click, "edge_color_click")

network_graph = from_networkx(G, nx.spring_layout,pos=fixed_positions, fixed = fixed_nodes,scale=10,center=(0,0))

### Set node_renderer/edge_renderer to specify the properties after click the node #########
network_graph.node_renderer.glyph = Circle(size='node_size', fill_color='node_color')
network_graph.node_renderer.selection_glyph = Circle(size='node_size', fill_color='node_color')
network_graph.node_renderer.hover_glyph = Circle(size='node_size', fill_color='node_color')

network_graph.edge_renderer.data_source.data["line_color"] = [G.get_edge_data(a,b)['color'] for a, b in G.edges()]
network_graph.edge_renderer.glyph = MultiLine(line_color="edge_color", line_alpha=0.2)
network_graph.edge_renderer.selection_glyph = MultiLine(line_color= "edge_color_click",  line_alpha=1)
network_graph.edge_renderer.hover_glyph = MultiLine(line_color="edge_color_click", line_alpha=1)
network_graph.edge_renderer.data_source.data["line_width"] = [G.get_edge_data(a,b)['weight'] for a, b in G.edges()]
network_graph.edge_renderer.glyph.line_width = {'field': 'line_width'}
network_graph.edge_renderer.selection_glyph.line_width = {'field': 'line_width'}
network_graph.edge_renderer.hover_glyph.line_width = {'field': 'line_width'}

network_graph.selection_policy = NodesAndLinkedEdges()


### Add network graph to the plot
plot.renderers.append(network_graph)


### Making interactive tables connected to the networkx
### `data`: data with all edge information. nodes information is merged to include "End Node Class"
Edges_DF = pd.DataFrame.from_dict(G.edges,orient='index').reset_index().rename(columns={'level_0':'start','level_1':'end'})
Nodes_DF = pd.DataFrame.from_dict(G.nodes,orient='index').reset_index()[['index','class']]
data = pd.merge(Edges_DF,Nodes_DF,left_on='end',right_on='index',how='left').drop(columns=['index'],axis=1)

### Making Data Table object in Bokeh using `data`
source = ColumnDataSource(data)

columns = [
        TableColumn(field="start", title="Start"),
        TableColumn(field="end", title="End"),
        TableColumn(field="class", title="End Node Class"),
        TableColumn(field="odds_ratio", title="Odds Ratio"),
        TableColumn(field="p-val", title="p-value"),
    ]

columns_2 = [
        TableColumn(field="start", title="Clicked"),
        TableColumn(field="end", title="Connected"),
        TableColumn(field="class", title="Connected Node Class"),
        TableColumn(field="odds_ratio", title="Odds Ratio"),
        TableColumn(field="p-val", title="p-value"),
    ]

### Making two tables based on the `source` data and columns selected
#### Desired Output: data_table will be displayed without change. `data_table_2` will be changed based on the selected node in the networkx (e.g., if Acetaminophen is selected, then all the rows having Acetaminophen in `Start` column will be selected and displayed.)
data_table = DataTable(source=source, columns=columns) #, width=600, height=280
data_table_2 = DataTable(source=source, columns=columns_2)


def selected_points(attr,old,new): ### Return the selected points ###
    selected_idx = network_graph.node_renderer.data_source.selected.indices #does not work
    print(selected_idx)

network_graph.node_renderer.data_source.selected.js_on_change('indices', CustomJS(args=dict(graph=network_graph.node_renderer.data_source,data=data), code="""
        const inds = cb_obj.indices;
        const d1 = data_table_2.data;
        d2 = []
        for (let i = 0; i < inds.length; i++) {
            d2.push(d1[inds[i]])
        }
        data_table_2.change.emit();
    """)
)


############ UPDATE END #############


plot.xgrid.visible = False
plot.ygrid.visible = False
plot.axis.visible = False
plot.outline_line_color = None


show(Column(plot,Row(data_table,data_table_2)))

save(plot, filename="May10_2022_Interactive_Plot.html")
