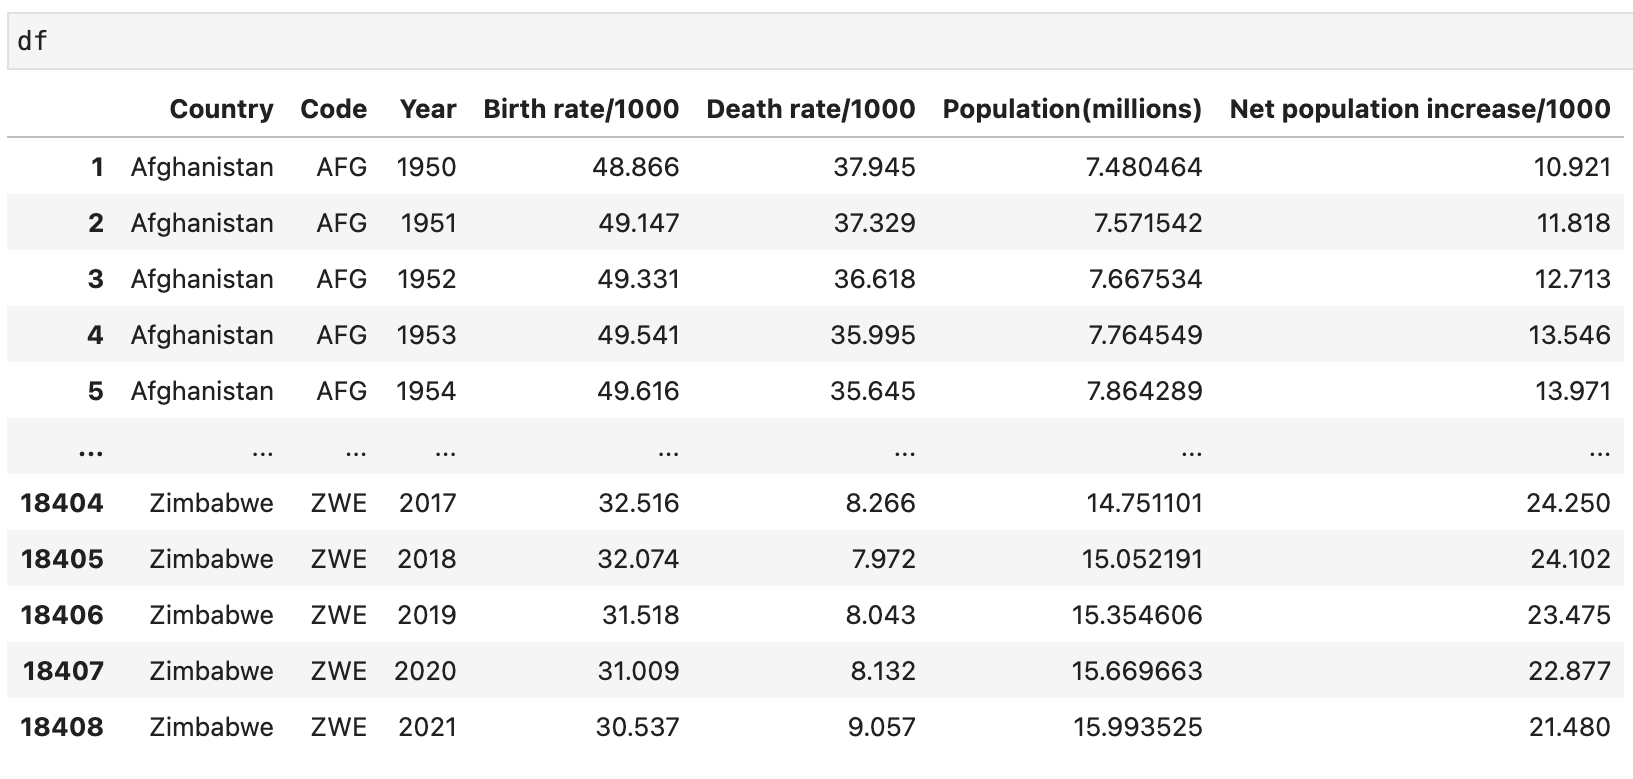
Hello everyone, I’m currently working on a project that seeks to analyze world population statistics and present the findings in an interactive data visualization dashboard. For context below is a picture of the data frame that I’m working with and a link to a plot that is similar to what I want to achieve.
So far I have gotten the multi-select widget to work fine as well as the hover tools, however at the moment, I’m having some trouble figuring out the best method on how to connect both the multi-choice widget and the range slider widget to the same plot i.e whether it would be a better idea to write separate callback functions or just put both into one.
Especially given the fact that the value from the range slider will directly affect the values used for the multi-select widget as the year range will decide what values to extract from the main data frame to display on the plot.
So far when I select a particular country it will just display the entire set of data it has for that country (i.e the country’s birth rate (y) against the country’s death rate (x) 1950 - 2021) however I would like the range slider to give the user that option to choose the range of data observed.
# Attempted call back at range slider
callbackrs = CustomJS(args={'data_source': data_source}, code="""
    var data = data_source.data;
    var range = cb_obj.value;
    data[df[(df['Year'] >= range[0]) & (df['Year'] <= range[1])];
    source.change.emit();
""")
# Define parameters for range slider
range_slider = RangeSlider(title='Year', start=1950, end=2021, step=1, value=(1950, 2021))
range_slider.js_on_change('value', callbackrs)
# JScallback for multi choice widget
callbackmc = CustomJS(args={'source': source, 'data_source': data_source}, code="""
    var data = data_source.data;
    var s_data = source.data;
    var selected = cb_obj.value;

    var Country = data['Country'];
    var death_rate_data = data['Death rate/1000'];
    var birth_rate_data = data['Birth rate/1000'];
    var net_data = data['Net population increase/1000'];

    var name = s_data['name']
    name.length = 0;
    var deathrate = s_data['deathrate'];
    deathrate.length = 0;
    var birthrate = s_data['birthrate'];
    birthrate.length = 0;
    var net = s_data['net'];
    net.length = 0;

    for (var i = 0; i < death_rate_data.length; i++) {
        if (selected.indexOf(Country[i]) >= 0) {
            name.push(Country[i]);
            deathrate.push(death_rate_data[i]);
            birthrate.push(birth_rate_data[i]);
            net.push(net_data[i]);
        }
    }
    source.change.emit();
""")


multi_choice = MultiChoice(title='Select Countries', value=[], options=data['Country'].unique().tolist())

multi_choice.js_on_change('value', callbackmc)

layout = Column(multi_choice, range_slider, p)
show(layout)
p.s I’m not the most familiar with JS callbacks and how to write them, however, I do know a decent amount of Javascript, so please bear with me.
Any assistance on this would be greatly appreciated