Console errors with bokeh.min.js after upgrade to 3.0.2

I have multiple bokeh web apps plotting snow and avalanche data (recently posted on the showcase page). I haven’t updated Bokeh in a while (updating from 2.4.1 to 3.0.2), so I’ve been working through each of my apps to update any deprecated Bokeh syntax.

After update (and fixing a couple minor Bokeh syntax issues), one of my apps is now failing to render locally. I get no Bokeh errors at the terminal (python-side), but I get errors in the browser console.

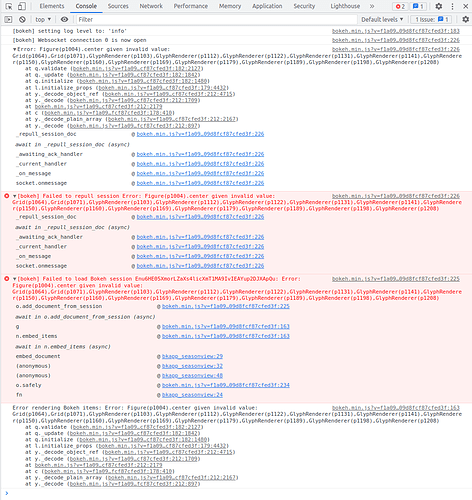
After running bokeh serve bkapp_seasonview, I see all my print statements in the python code without any errors, and in the console I get the following screenshot (see below).

No minimal, reproducible example at this time, just asking initially to see if this rings any bells for anyone, or if there are some recommendations on where to look??

Thank you,
Patrick

Are you manually assigning/adding things to plot.center ?

No, the center part of that traceback confused me. In fact, I have grepped the entire bokeh app directory and can find no usage of center.

I can also add that I have other similar apps that are running fine, so it seems my install of bokeh==3.0.2 and dependency upgrades is OK.

I wonder if you have a Python/JS version mismatch somehow. AFAIK center is only used for “layout-ish” things (e.g. grids, legends) and glyph renderers now go in a separate renderers property. Here is the case with a simple scatter plot, for example:


In [6]: p.center
Out[6]: [Grid(id='p1025', ...), Grid(id='p1032', ...), Legend(id='p1075', ...)]

In [7]: p.renderers
Out[7]: [GlyphRenderer(id='p1059', ...)]

But this was also the case for 2.4.3 AFAICT so I am not sure what change would be causing glyph renderers to be getting added to center in your case.

I am running Python 3.8.6 in a virtualenv.

For “layout-ish” things, I am creating multiple figures with bokeh.plotting.figure (figures include legend using bokeh.models.Legend and bokeh.models.LegendItem).

I then put the figures together with various widgets, all laid out using bokeh.layouts.row, column, Spacer, etc… and then make a layout with:

l = bokeh.layouts.layout(layout_list, sizing_mode='stretch_width')
bk.plotting.curdoc().add_root(l)

Maybe I will inspect center for my my figures and see if any glyph renderers are being included.

Sure enough, inspecting center for all of my bokeh.plotting.figure objects seems to include GlyphRenderers for all of them:

In [4]: precip_fig.center                                                                            
Out[4]: 
[Grid(id='p1064', ...),
 Grid(id='p1071', ...),
 GlyphRenderer(id='p1103', ...),
 GlyphRenderer(id='p1112', ...),
 GlyphRenderer(id='p1122', ...),
 GlyphRenderer(id='p1131', ...),
 GlyphRenderer(id='p1141', ...),
 GlyphRenderer(id='p1150', ...),
 GlyphRenderer(id='p1160', ...),
 GlyphRenderer(id='p1169', ...),
 GlyphRenderer(id='p1179', ...),
 GlyphRenderer(id='p1189', ...),
 GlyphRenderer(id='p1198', ...),
 GlyphRenderer(id='p1208', ...)]

In [5]: airtemp_fig.center                                                                           
Out[5]: [Grid(id='p1277', ...), Grid(id='p1284', ...), GlyphRenderer(id='p2243', ...)]

In [6]: wind_fig.center                                                                              
Out[6]: 
[Grid(id='p2312', ...),
 Grid(id='p2319', ...),
 GlyphRenderer(id='p2347', ...),
 GlyphRenderer(id='p2531', ...),
 GlyphRenderer(id='p2583', ...),
 GlyphRenderer(id='p2827', ...),
 GlyphRenderer(id='p2903', ...),
 GlyphRenderer(id='p3039', ...),
 GlyphRenderer(id='p3079', ...)]

Here’s an example of the plotting code for one figure (sorry for the non-minimalism!):

def build_precip_fig(df, config):
  '''
  Builds precip/depth plot for one or more stations.

  Parameters
  ----------
  df: a Pandas DataFrame 
    Must be indexed by datetime, index must be named Date
    Must have 2 columns per station (precip and depth).
    Columns must follow naming convention.
  config: dict
    Uses station id for keys (i.e. 'CYFM8')

  Returns
  -------
  bokeh.plotting.figure instance
  '''
  
  df.index.name = 'Date'
  
  DAILY_BAR_WIDTH = (0.80 * (1000.0 * 60.0 * 60.0 * 24.0)) # millisecs to a day

  source = bkm.ColumnDataSource(df)

  fig = bkp.figure(
    title="Precipitation & Snow Depth",
    name='precip_fig',
    x_axis_type='datetime',
    y_axis_label='SWE (in)',
    height=300,
    tools='pan,box_zoom,wheel_zoom,save',
    toolbar_location='above'
    )

  fig.toolbar.logo = None
  fig.toolbar.active_drag = None
  fig.yaxis.axis_label_standoff = 10
  fig.yaxis.minor_tick_line_color = None

  #fig.y_range = bkm.Range1d(-5, df[filter(lambda x: '_dir' not in x, df.columns)].max().max())
  
  # Hard-coded y-ranges nice for this panel so you can easily tell small vs large precip amounts
  # Otherwise the range would zoom for just trace amounts of precip
  # May have to decide how to set this different for mega precip zones like AK
  fig.y_range = bkm.Range1d(-0.1, 3)
  fig.yaxis.ticker = [0,0.5,1,1.5,2,2.5,3]

  fig.extra_y_ranges = {"HS": bkm.Range1d(start=-5, end=150)}
  fig.add_layout(bkm.LinearAxis(y_range_name="HS", axis_label='HS (in)', ticker=list(range(0,151,25))), 'right')
  
  df.index.name = 'Date'

  stids = list(set([c.split('_')[0] for c in df.columns]))

  # Use 'order' entry in config to arrange the stns in preferred plotting order
  order_list=[]
  for s in stids:
    order_list.append(config['stations'][s]['order'])
  stids_sorted = [x for _,x in sorted(zip(order_list,stids))]

  df['date_hover'] = df.index.strftime('%Y-%m-%d') # Important to do AFTER making stids
  source = bkm.ColumnDataSource(df)

  legend_items = []
  tooltips=[("Date", "@date_hover")]
  
  for stn in stids_sorted:
    color = config['stations'][stn]['color']
    lname = config['stations'][stn]['long_name']
    precip_option = config['stations'][stn]['precip_option']
    
    if precip_option == 'accum_one_hour':
      swe = '{}_precip_accum_one_hour_24hr_sum'.format(stn)
      tooltips.append(("%s swe | depth" % lname, "@%s_precip_accum_one_hour_24hr_sum{1.11} | @%s_snow_depth_24hr{int}" % (stn, stn)))
    elif precip_option == 'snotel':
      swe = '{}_snow_water_equiv_24hr_diff'.format(stn)
      tooltips.append(("%s swe | depth" % lname, "@%s_snow_water_equiv_24hr_diff{1.11} | @%s_snow_depth_24hr{int}" % (stn, stn)))
    elif precip_option == '':
      swe = None
      tooltips.append(("%s swe | depth" % lname, "0.00 | @%s_snow_depth_24hr{int}" % stn))
    depth = '{}_snow_depth_24hr'.format(stn)
  
    if swe is not None:
      swebar = fig.vbar(
          x='Date',
          width=DAILY_BAR_WIDTH,
          bottom=0,
          top=swe,
          line_width=0,
          line_alpha=0,
          fill_alpha=0.4,
          color=color,
          name="{}_bar".format(swe),
          source=source
      )
      fig.add_layout(swebar)
    
    depthline = fig.line(x='Date', y=depth, line_width=1.5, name="{}_line".format(depth), color=color, alpha=0.9, y_range_name='HS', source=source)
    fig.add_layout(depthline)

    if swe is not None:
      legend_items.append(bkm.LegendItem(label=lname, renderers=[swebar, depthline]))
    else:
      legend_items.append(bkm.LegendItem(label=lname, renderers=[depthline]))

  hline_hover = fig.line(x='Date', y=1, line_width=0.0, alpha=0.0, source=source)
  fig.add_layout(hline_hover)

  fig.add_tools(bkm.HoverTool(
    renderers=[hline_hover],
    tooltips=tooltips,
    line_policy="nearest",
    mode='vline'
    )
  )

  legend = bkm.Legend(
      items=legend_items,
      location=(0, 15),
      glyph_height=20,
      glyph_width=30,
      label_height=1,
      label_width=50,
      label_text_baseline="middle",
      label_text_font_size="10pt",
      border_line_alpha=0.0,
      orientation="horizontal",
      padding=5,
      spacing=15,
      label_standoff=2
  )

  fig.add_layout(legend, 'below')
  fig.legend.click_policy = "hide"

  return fig
Are you passing glyph renderers to add_layout? That defaults to "center" so that is a way that things could end up in center, even though the code grep turned up empty. It’s also possible Bokeh 2.4.x was more tolerant about things ending up in the wrong place, which would explain things.

Yes, it appears I am adding glyph renders to add_layout. Hmmmm, I wonder how that usage snuck into our codebase.

    if swe is not None:
      swebar = fig.vbar(
          x='Date',
          width=DAILY_BAR_WIDTH,
          bottom=0,
          top=swe,
          line_width=0,
          line_alpha=0,
          fill_alpha=0.4,
          color=color,
          name="{}_bar".format(swe),
          source=source
      )
      fig.add_layout(swebar)
    
    depthline = fig.line(x='Date', y=depth, line_width=1.5, name="{}_line".format(depth), color=color, alpha=0.9, y_range_name='HS', source=source)
    fig.add_layout(depthline)
1 Like

@Bryan that did it!

I removed any occurence of add_layout for a glyph renderer, and things are now working. I am not sure how or why that pattern snuck into our code, but it was certainly tolerated in bokeh==2.4.1.

As always, thanks very much for you insight.

2 Likes

This topic was automatically closed 90 days after the last reply. New replies are no longer allowed.