My app controls a temperature/humidity datalogger and is written as a multi-tabbed Bokeh app with multiple widgets, all running on a Bokeh server.
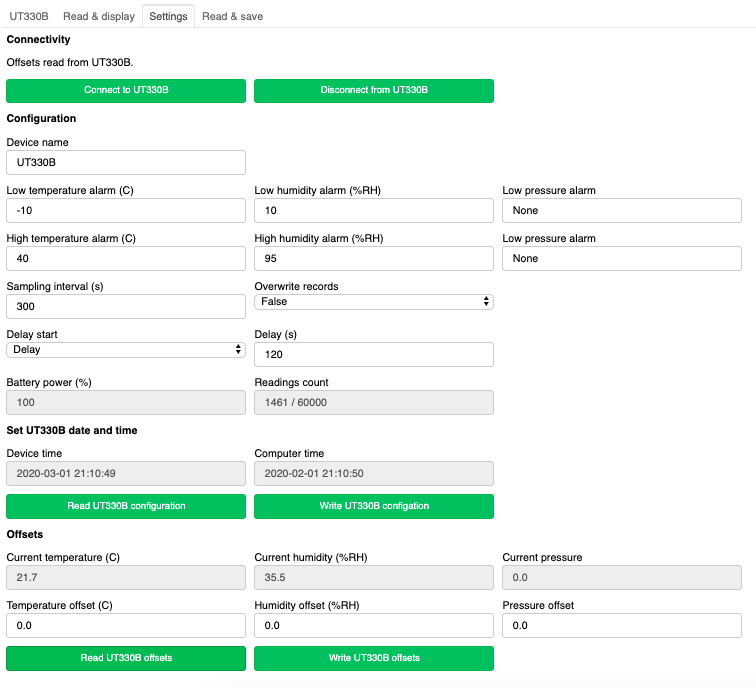
The device settings are controlled via a settings tab which makes use of various widgets, including button, textinput, and div. Because it can take a long time to load data from the device, I use callbacks to update the text display widget that reading is taking place, and a separate callback to do the actual reading (using this line of code curdoc().add_next_tick_callback(self.read_data_2)).
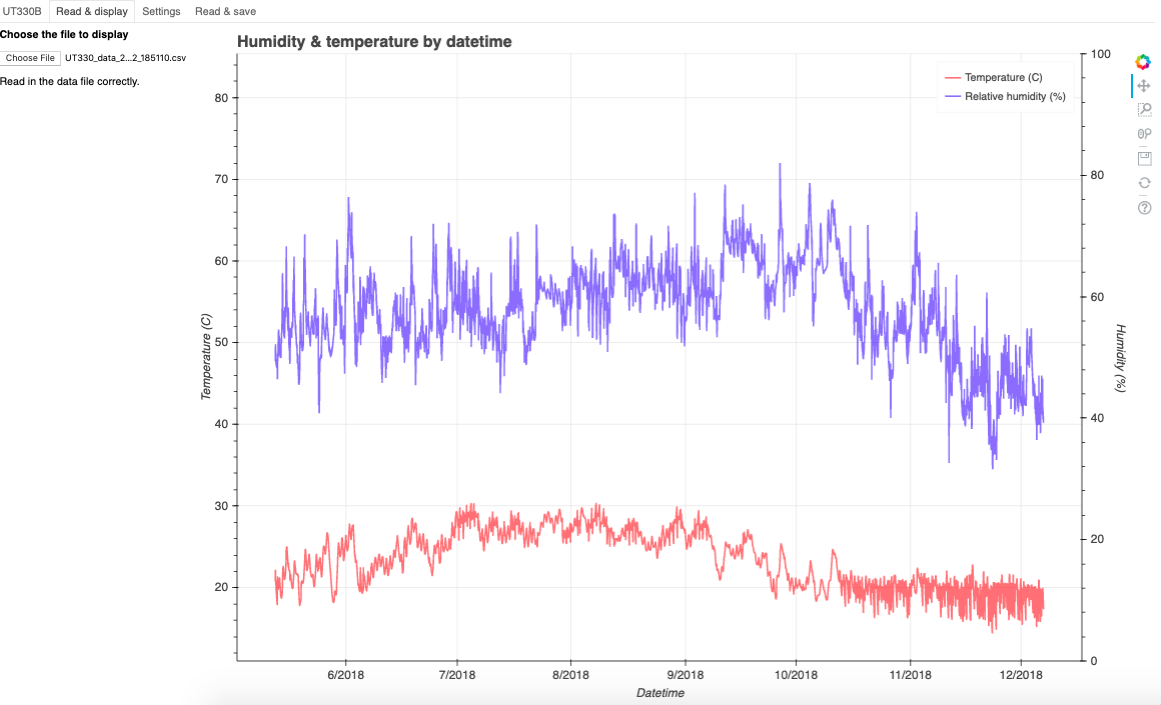
The temperature and humidity data is displayed on a chart tab, which obviously includes a datetime figure, but also uses the fileinput widget to load up data.
The code is on Github here: https://github.com/MikeWoodward/UT330B
Here are some screenshots of my app.