I’ve put together a Bokeh app that provides a detailed visualization for Covid19 data for Portugal in a way that I find be more useful than what is available in the official dashboards. The code is open source and can be reused for similar projects.
I have data auto downloading everyday and it sometimes comes with holes, so I will gradually patch the code for better resistance to deviations from the ideal data reporting. This is one such case.
thanks for sharing this very nice dashboard.
I would like to point to you our Python Covid Analysis toolkit (aka pycoa, www.pycoa.fr 100% Open/Free source).
We have added recently Portugal Covid Cases using Direcção Geral de Saúde - Ministério da Saúde Português data.
So far only Covid Cases is available.
You have the possibility to draw map, histo/pie and dateplot chart.
Please do not hesitate to have a look into our code (GitHub - coa-project/pycoa: pycoa Python source code the dev version). There is a demo Nootebook without installation using (the amazing) binder techno
(GitHub - coa-project/coadocker: Dokerfile and click to ‘launch binder’)
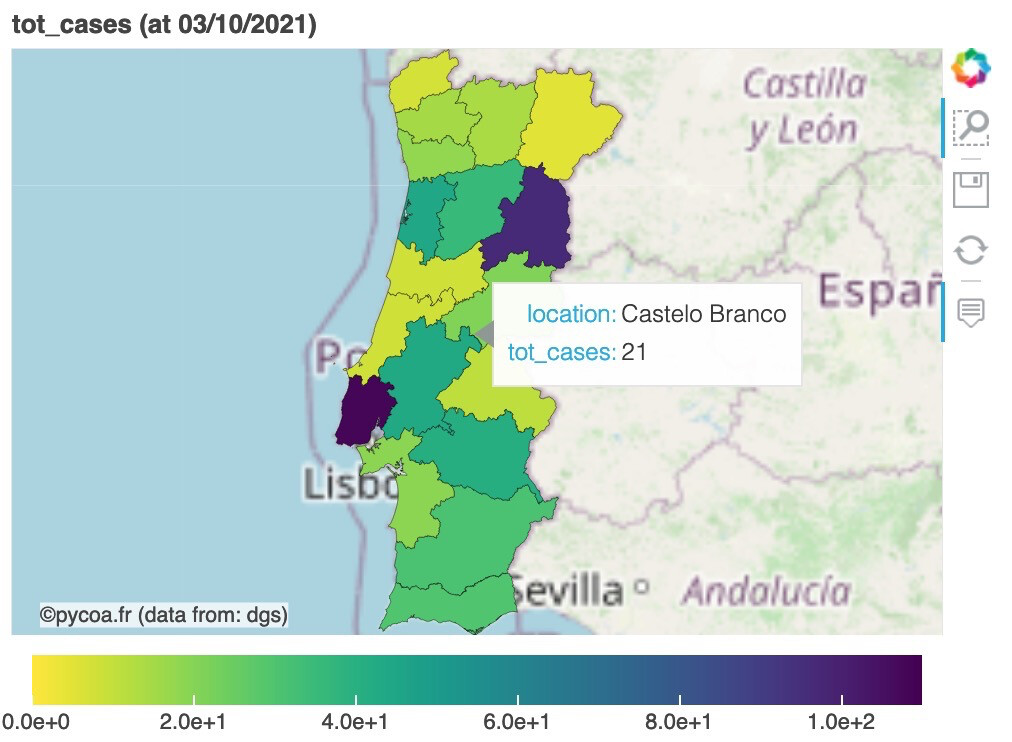
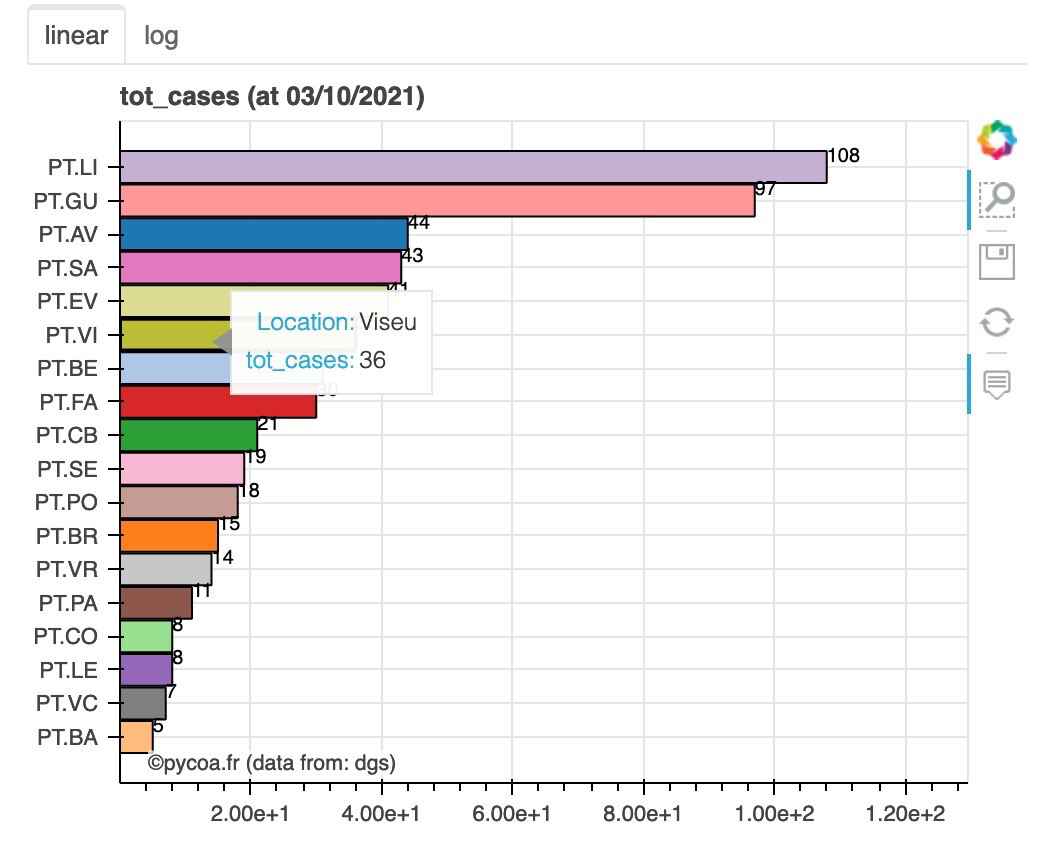
Here an example of a map and a histogram.
Hope you will like it.
cheers
Olivier
Thanks for the link, does information on the Portugal Covid variant are present ? Here the csv file I use https://raw.githubusercontent.com/dssg-pt/covid19pt-data/master/data_concelhos_new.csv.
Since this discussion is not related to Bokeh may be we can continue this discussion off line
(using our github account for instance).
Have a good days.
Cheers
Olivier