I’ve created a notebook to map current covid incidence for Germany, using bokeh and geopandas. The notebook is short and fetches the required data from other sources. More info on my GitHub repository and the notebook can also be run stand-alone on Google Colab.
Feel free to run it yourself, expand and/or adapt to other countries.
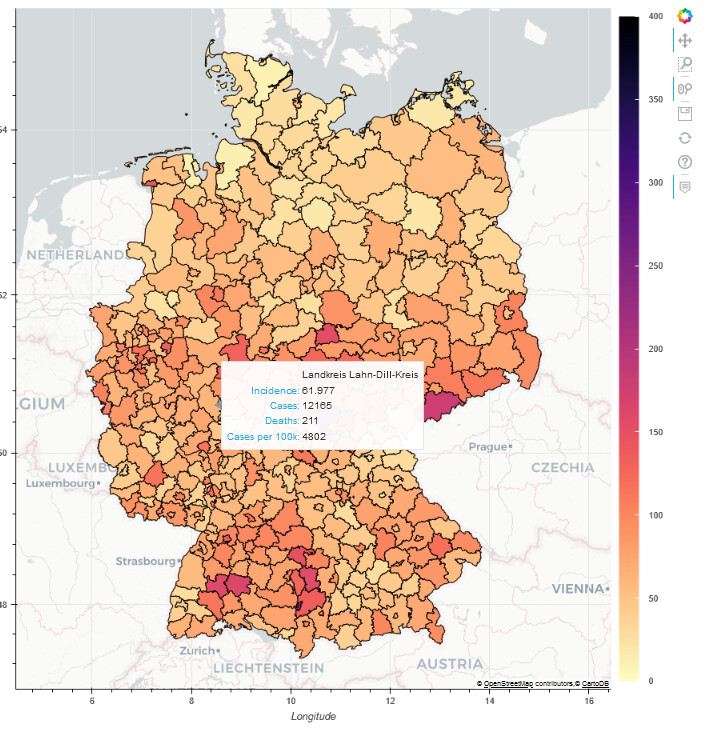
Below a screenshot of the final result, showing the window with additional data that pops out when hovering over the map:
Many thanks for the kind word, and feel free to tweet about it… my handle is @jfexbrayat (like here or on GitHub). That’d be awesome to see other users use this as a skeleton for their own project, or expand this one with additional features.
@jfexbrayat Good job and thanks for sharing.
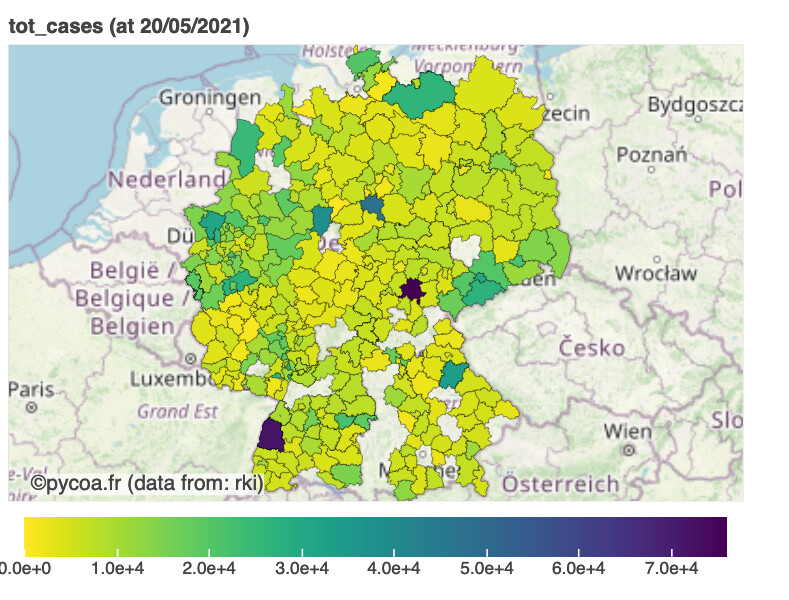
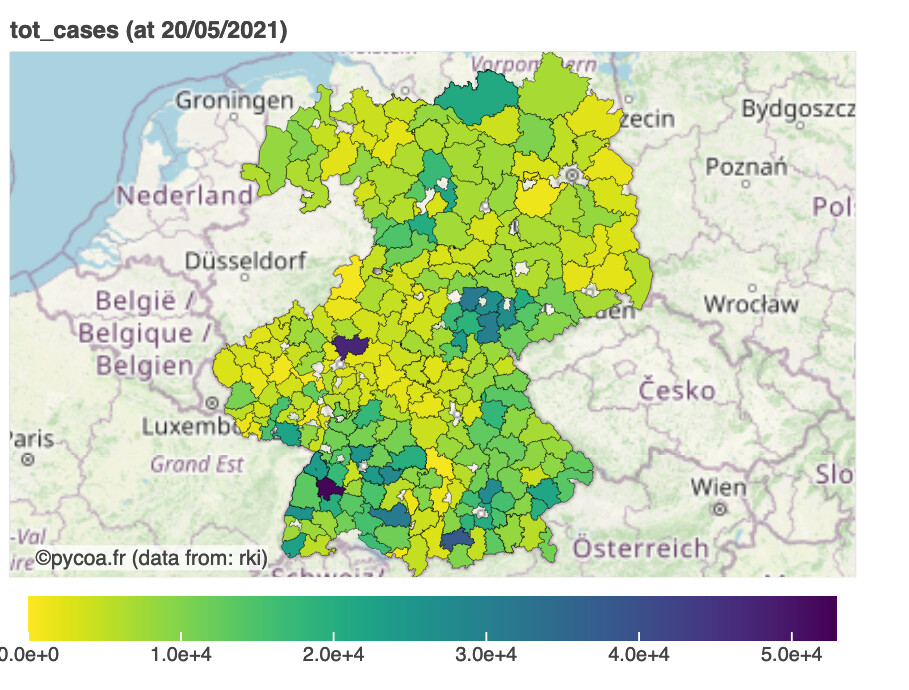
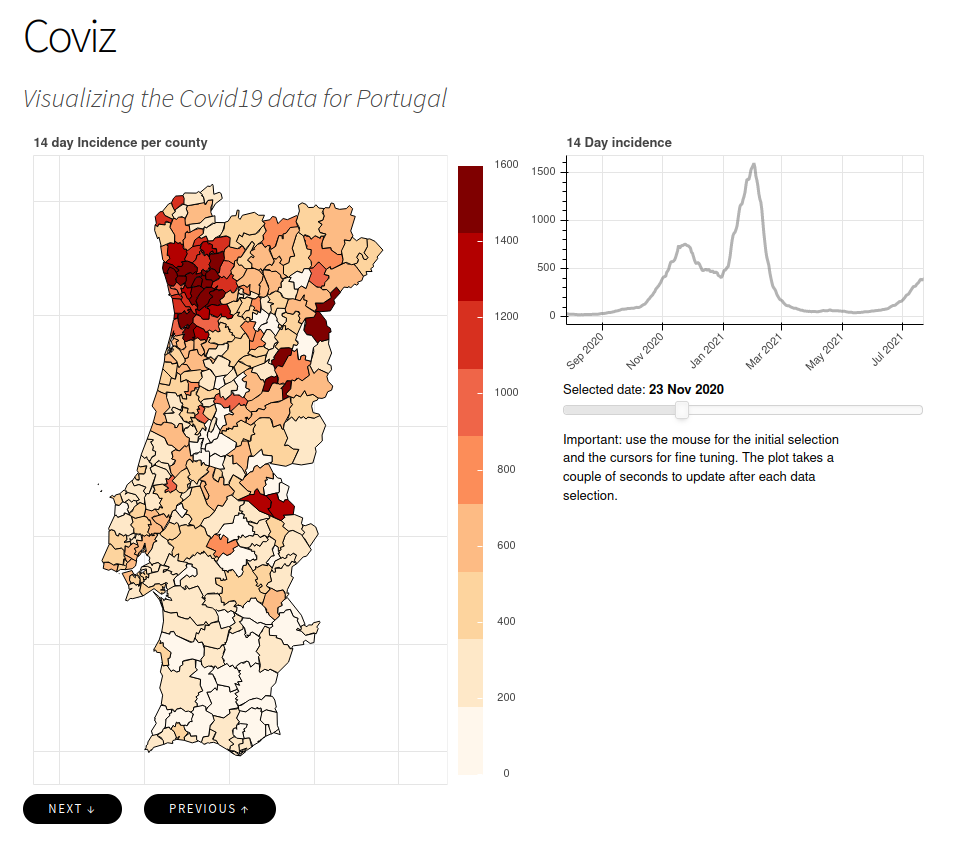
In our PyCoa project (www.pycoa.fr) we are trying to parse the maximum national covid db we can (for the moment France, Spain, Portugal, UK, Italy, India, USA, Belgium and recently Germany).
We struggle since few days with the German implementation (we use the Robert Koch Institut’s db) Our problem is from German region coding …
I guess the ~5s delay when plotting is due to bokeh replotting the map every single time and this may be affected by the server’s specs: is your bokeh server hosted locally or on the cloud? Best would be if bokeh would cache all figures upon starting the server, but I don’t know if it’s possible / how you’d do it.
This runs on a cloud instance with bokeh and nginx. I can always upgrade the instance if nothing better comes up.
I am recalculating the map at each slider change because I don’t have acess to the ColumDataSource that is created inside plot_bokeh. In my non-geo plots that callback of the sliders updates the ColumnDataSource and that makes the plot change, but in this case I don’t have it. I posed the question here:
sorry I was on vacation I have missed your question …
Yes the shapes exist for other countries but sometimes it is quit difficult to find them.
Please have a look go our geo class :
you will find several json description (like FRA,DEU, GBR,IND,USA,MYS, BEL,PRT, ESP, CHL, …)