Create a DateRangeSlider in Bokeh

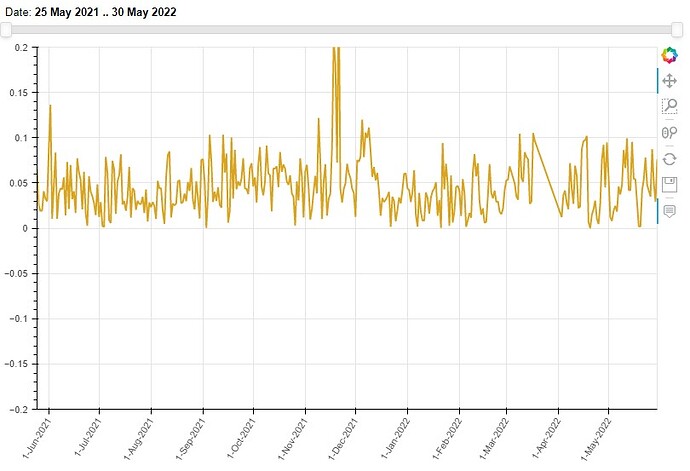
I want to make a DateRangeSlider.
I have written the following code but I have two problems:
1- When I change the DateRangeSlider, the chart is hidden! (disappears)
2- When I change the DateRangeSlider, the X-axis does not change.
please guide me.

from bokeh.plotting import figure, output_file, show
import pandas as pd
from bokeh.plotting import figure, show
from bokeh.io import output_file
from bokeh.models import ColumnDataSource,HoverTool,Range1d,DatetimeTicker,DatetimeTickFormatter, ColumnDataSource,ColumnDataSource,HoverTool
from bokeh.models import DateRangeSlider
import numpy as np
from bokeh.layouts import layout, column
from bokeh.models.callbacks import CustomJS
from bokeh.plotting import figure, output_file, show, save

#Read csv file
dataset= pd.read_csv(r"Example.csv")
Date1=dataset["Date"]
dataset['Date'] = pd.to_datetime(dataset['Date'])
STD= dataset["STD"]
Date5=list(dataset['Date'])
datase = pd.to_datetime(Date5, format='%Y-%B-%d')


# keep track of the unchanged, y-axis values
source = ColumnDataSource(data={'x': dataset['Date'], 'y': STD}) 
source2 = ColumnDataSource(data={'x': dataset['Date'], 'y': STD})

# output to static HTML file
output_file('sliders.html')

hover = HoverTool(
    tooltips=[('Date', '@x{%F}'), ('STD', '@y')],
    formatters={'@x': 'datetime'},)
    
TOOLS="pan,wheel_zoom,box_zoom,reset,save"

ss=list(dataset['Date']) 
yr1 = Range1d(start=-0.2, end=0.2)
xr1 = Range1d(start=ss[0] , end=ss[-1])

p = figure(x_range=xr1,y_range=yr1,tools=TOOLS, width=800, height=500)

# add a line renderer with legend and line thickness
p.line(x='x',y='y',source=source, line_color="#DAA520", line_width=2,alpha=1)
p.xaxis.ticker = DatetimeTicker(desired_num_ticks=12)
p.xaxis.formatter = DatetimeTickFormatter(days=["%d-%b-%Y"],months=["%d-%b-%Y"])

p.xaxis.major_label_orientation = 45
p.add_tools(hover)
plot_width = 800

startdate=datase[0]
enddate=datase[-1]

slider = DateRangeSlider(start=startdate, end=enddate, value=(startdate,enddate),
            step=1, title='Date')

# Adding callback code
callback = CustomJS(args=dict(source=source, ref_source=source2), code="""
        // dates returned from slider are not at round intervals and include time;
        const date_from = Date.parse(new Date(cb_obj.value[0]).toDateString());
        const date_to = Date.parse(new Date(cb_obj.value[1]).toDateString());
        
        const data = source.data;
        const ref = ref_source.data;
        
        const from_pos = ref["x"].indexOf(date_from);
        // add + 1 if you want inclusive end date
        const to_pos = ref["x"].indexOf(date_to);
            
        // re-create the source data from "reference"
        data["y"] = ref["y"].slice(from_pos, to_pos);
        data["x"] = ref["x"].slice(from_pos, to_pos);

    
    source.change.emit();
""")

slider.js_on_change('value', callback)

# Arrange plots and widgets in layouts
layout = column(slider, p)

output_file('exam.html')

show(layout)

Hi @Keyhan please edit your post to use code formatting so that the code is intelligible (either with the </> icon on the editing toolbar, or triple backtick ``` fences around the code blocks)

Hi
Thank you
can you help me?

I would like to try, now that you have formatted your code, I see that it relies on an data file that you have not included. The best way t help others help you is to make sure you provide a Minimal Reproducible Example, i.e. code that can actually be run directly in order to investigate. Can you provide a link to a suitable data file, or update the code to generate suitable synthetic data?

Thankful
Yes I uploaded it and here is the link:

@Keyhan Your JS callback does not work because the datetime values of the slider are not the same as the datetime values in the ColumnDataSource. E.g. when you search using

ref["x"].indexOf(date_from)

the return value is -1 indicating “not found”. This is not really surprising, in general there is no reason to expect that the slider values (which are just even divisions between start and end) would exactly match the arbitrary data values. You’d have to go out of your way to somehow orchestrate that coincidence.

You will need to actually scan the x values in the data source to find the index of the ones closest to the slider start/end.

Thank you
But I’m new to bokeh. I don’t have much information.
No matter how much I changed the code, I did not get the result!
Can you advise more?
I have used the following code.
But it doesn’t work for me!

Even when I copy this code and run it, it doesn’t work for me!
And it has the same problems as I said in the topic.

Thanks

This isn’t really a Bokeh issue, per se, it’s a general programming/logic error. You are getting a value from the slider, and looking for that exact value in the array of “x” values. But the exact value from the slider is not in the array of “x” values (there’s no reason, in general, that it would be). Instead of looking for an exact match in the “x” values using indexOf, you will have to search the “x” values for the one that is nearest to the slider value. I.e. will need to loop over the “x” values and compare each one to the slider value, and stop when you find the one you want.

Edit: The reason that the SO example “works” is because that code goes out of its way to make sure that the slider values happen to also be the same values in the “x” array. But you can’t count on that being feasible in general, so it’s a fragile approach. It’s better to do a search as I suggested above.

It’s also worth mentioning another option, that might be simpler for you, which is to use the RangeTool instead of a slider:

If all you are needing to do is to change the view window that is visible, then a range tool won’t require any JS code at all.

Thank you very much, this is a better solution.

1 Like

This topic was automatically closed 90 days after the last reply. New replies are no longer allowed.