Hi everyone,
I’m trying to create a table full of widgets. Let’s say I have several series of data, they all have the same parameters. I’d like to filter each serie with a certain value of the parameters. I don’t have a problem with implementing the widgets to do so but it’s more a question of layout.
Is it possible to use the DataTable widget and change the sources to widgets or do I have to create a layout for each widget that would ressemble a table ?
For instance, I’d like to make the blue ones CheckBoxGroup, the red ones just names and the yellow ones Select widgets.
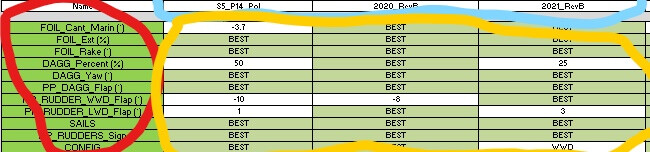
Then each serie will be filtered from what’s been selected and it will plot accordingly.
Thank you for any help or advise !
I may not be entirely clear on what you’re asking for, but I can say that in the past I’ve used checkbox groups and/or radiobuttons/radiogroups to filter data that’s being displayed in a table (and a bunch of linked plots too). It was done using a CustomJSFilter that returned the indices within a single datasource the matched the currently selected values in the checkbox group and/or radiogroup/buttons. This kind of setup goes a bit beyond the standard GroupFilter which as far as I know can only filter for one group at a time (so won’t really work for checkbox groups).
For what I think you’re after, you’d implement either a CustomJSFilter or GroupFilter on your radiobutton/group (aka what you have circled in red). That’ll take care of filtering the “rows”. Now to add/remove table column elements to a table on the fly, that’ll be a bit different and I’d probably ruthlessly exploit dictionaries to do so → Instantiate TableColumn objects for every column, and pass them into a “tbl_dict” that looks kinda like this:
tbl_dict = {‘column_name’:TableColumn()…}
Then you pass tbl_dict, the table instance, and the checkboxgroup into the callback, and within that callback you:
- ID which checkboxes are selected
- retrieve the corresponding TableColumn instances from tbl_dict
- assign them to the table instance
Is that what you’re after? If so, build up a basic working example with dummy data, and comment the areas of code you’re stuck on etc. Happy to help, I haven’t done the dynamic column add/subtract thing before so would also be keen to flesh this out.
Thank you for your answer!
I’m not sure I entirely understand your response as well.
I don’t have a problem with the filtering data it’s more about the layout.
I would like to avoid having to do 33 Select widgets (3 columns and 11 rows like in the picture) and was wondering if that could be done with a datatable.
Maybe my question doesn’t make sense or there is just not any answer.
Let me know if that’s more clear and if that corresponds to what you’ve explained above.
“I would like to avoid having to do 33 Select widgets (3 columns and 11 rows like in the picture”
You definitely don’t need to do this.
Read the docs for instantiating CheckBoxGroups and RadioGroup (or RadioButtonGroup depending on the aesthetic you prefer). You can instantiate multiples of these and pass them all into the same callback so as to get multiple filters on your dataset. So for your example, it’d be 2 different widgets. 1) a Checkbox group, with 3 options/values to cover the columns and 2) a radiogroup with 11 values to filter the rows.
That’s where I’m not sure I explained clearly or I still don’t understand what you are suggesting. Are you saying that I could just write down a certain value let’s say in B5 (so column 2020_RevB and row Dagg Yaw) and the serie 2020_RevB would update its data so that it onlys keeps the data where Dagg Yaw is equal to the value I’ve put down ?
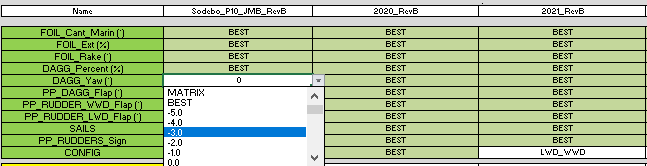
Sorry for all the confusion, hopefully that image is a bit clearer
Essentially, yes, but with a different implementation where the dropdown is not within the table.
I’m saying 1) Instantiate a checkboxgroup, radiogroup or any other of the widgets (something like the dropdown thing you’ve shown here is also available but I forget what it’s called, probably a “select” widget). Have that widget the options (0,-1.0,-2.0…BEST,MATRIX). Then 2) instantiate another widget with all the options in your Name column. Then you can then use both those widgets to filter/update the table. The idea is not to have the widget within the table, but to modify/filter the table based on the values selected in multiple widgets.
Ok I think I get what you mean, I’m still unsure about the layout of this but I’ll try something. Thank you for your help!
I made a multifilter example with dummy data. Get ‘data.csv’ from here : data.csv · GitHub
Code:
import pandas as pd
import numpy
from bokeh.models import ColumnDataSource, CustomJS, RadioGroup, CheckboxGroup, CustomJSFilter, CDSView
from bokeh.models.widgets import DataTable, TableColumn
from bokeh.plotting import figure, save
from bokeh.layouts import layout

df = pd.read_csv('data.csv').reset_index()
#create source
src = ColumnDataSource({x:df[x].tolist() for x in df.columns})
#instantiate two widgets, one to filter sex one at a time and one to filter multiple options of eye colour
rgp = RadioGroup(labels=df['Sex'].unique().tolist(),active=0)
cbg = CheckboxGroup(labels=df['Eye'].unique().tolist(),active=list(range(len(df['Eye'].unique()))))

#create customjsfilter --> want to pass: -the datasource, the filtering widgets, and dictionaries that map the active property in the widget to the actual string of the thing
filt = CustomJSFilter(args=dict(src=src,rgp=rgp,cbg=cbg
                                ,rgp_dict={i:x for i,x in enumerate(df['Sex'].unique())}
                                ,cbg_dict={i:x for i,x in enumerate(df['Eye'].unique())}
                                                                  )
                      ,code='''
                      //retrieve an array of eye color strings checked off in the checkboxgroup
                      const cbg_active = cbg.active.map(x=>cbg_dict[x])
                      //retrieve a string corresponding to the selected sex
                      const rgp_active = rgp_dict[rgp.active]
                      //go through all the rows in the source, and add the indice to a "sel_indices" if the current row meets the two filter criteria
                      //i.e. if the sex=the selected sex in the radiogroup, and the eye color is contained within the array of checked off eye colors
                      const sel_indices = []
                      for (let i = 0; i < src.get_length(); i++){
                              if (src.data['Sex'][i]==rgp_active && cbg_active.includes(src.data['Eye'][i])){
                                      sel_indices.push(i)}
                              }
                      return sel_indices;
                      ''')
#create a cdsview on the src with this custom filter applied
view = CDSView(source=src,filters=[filt])
#this part always messes me up but it makes sense. You need to add a mini callback "listener" to both widgets so that whenever their active property gets altered, the change in the source (i.e. the latest applied filter) gets emitted
rgp.js_on_change('active',CustomJS(args=dict(src=src),code='''src.change.emit()'''))
cbg.js_on_change('active',CustomJS(args=dict(src=src),code='''src.change.emit()'''))

#create columns
columns = [TableColumn(field=x,title=x) for x in df.columns]
#create a table from those columns, the source, and the view
tbl = DataTable(source=src,columns=columns,width=500,height=1200,view=view)
#crappy basic layout but i'll leave the aesthetics to someone else
lo= layout([cbg,rgp,tbl])
save(lo,'tbl_filt.html')
This will filter the table for multiple conditions, as user specified via two different widgets:
Now what I was getting at before was if you wanted to modify the columns attached to the table via callback , so say in this example there was a checkbox group for “Age” and “Height” and on check, the entire column would show/hide. That’d involve something a bit different but it’s totally doable.
As always, I strongly strongly recommend console.logging the crap out of the CustomJS callback to inspect what’s happening (because that’s how I learned haha).
Thank you for your example!
But again, here you only have on dataframe that gets updated when in my case, I would have three different dataframes that share the same column names. And I want to update them specifically. The value I choose for the dagg yaw for dataframe 1 might be different for dataframe 2.
Therefore, I can only see your solution to work if I do 3 specific tables with widgets working for each dataframes.
I think I see what you’re saying. Not sure how you could expect to achieve it without making 33 unique “select” widgets, with each one being responsible for filtering a particular source by a particular column for a particular value. Should not be too bad to assemble with loops/dictionaries and bokeh’s layout options → tabs might be helpful too.
1 Like
This topic was automatically closed 90 days after the last reply. New replies are no longer allowed.