Hi,
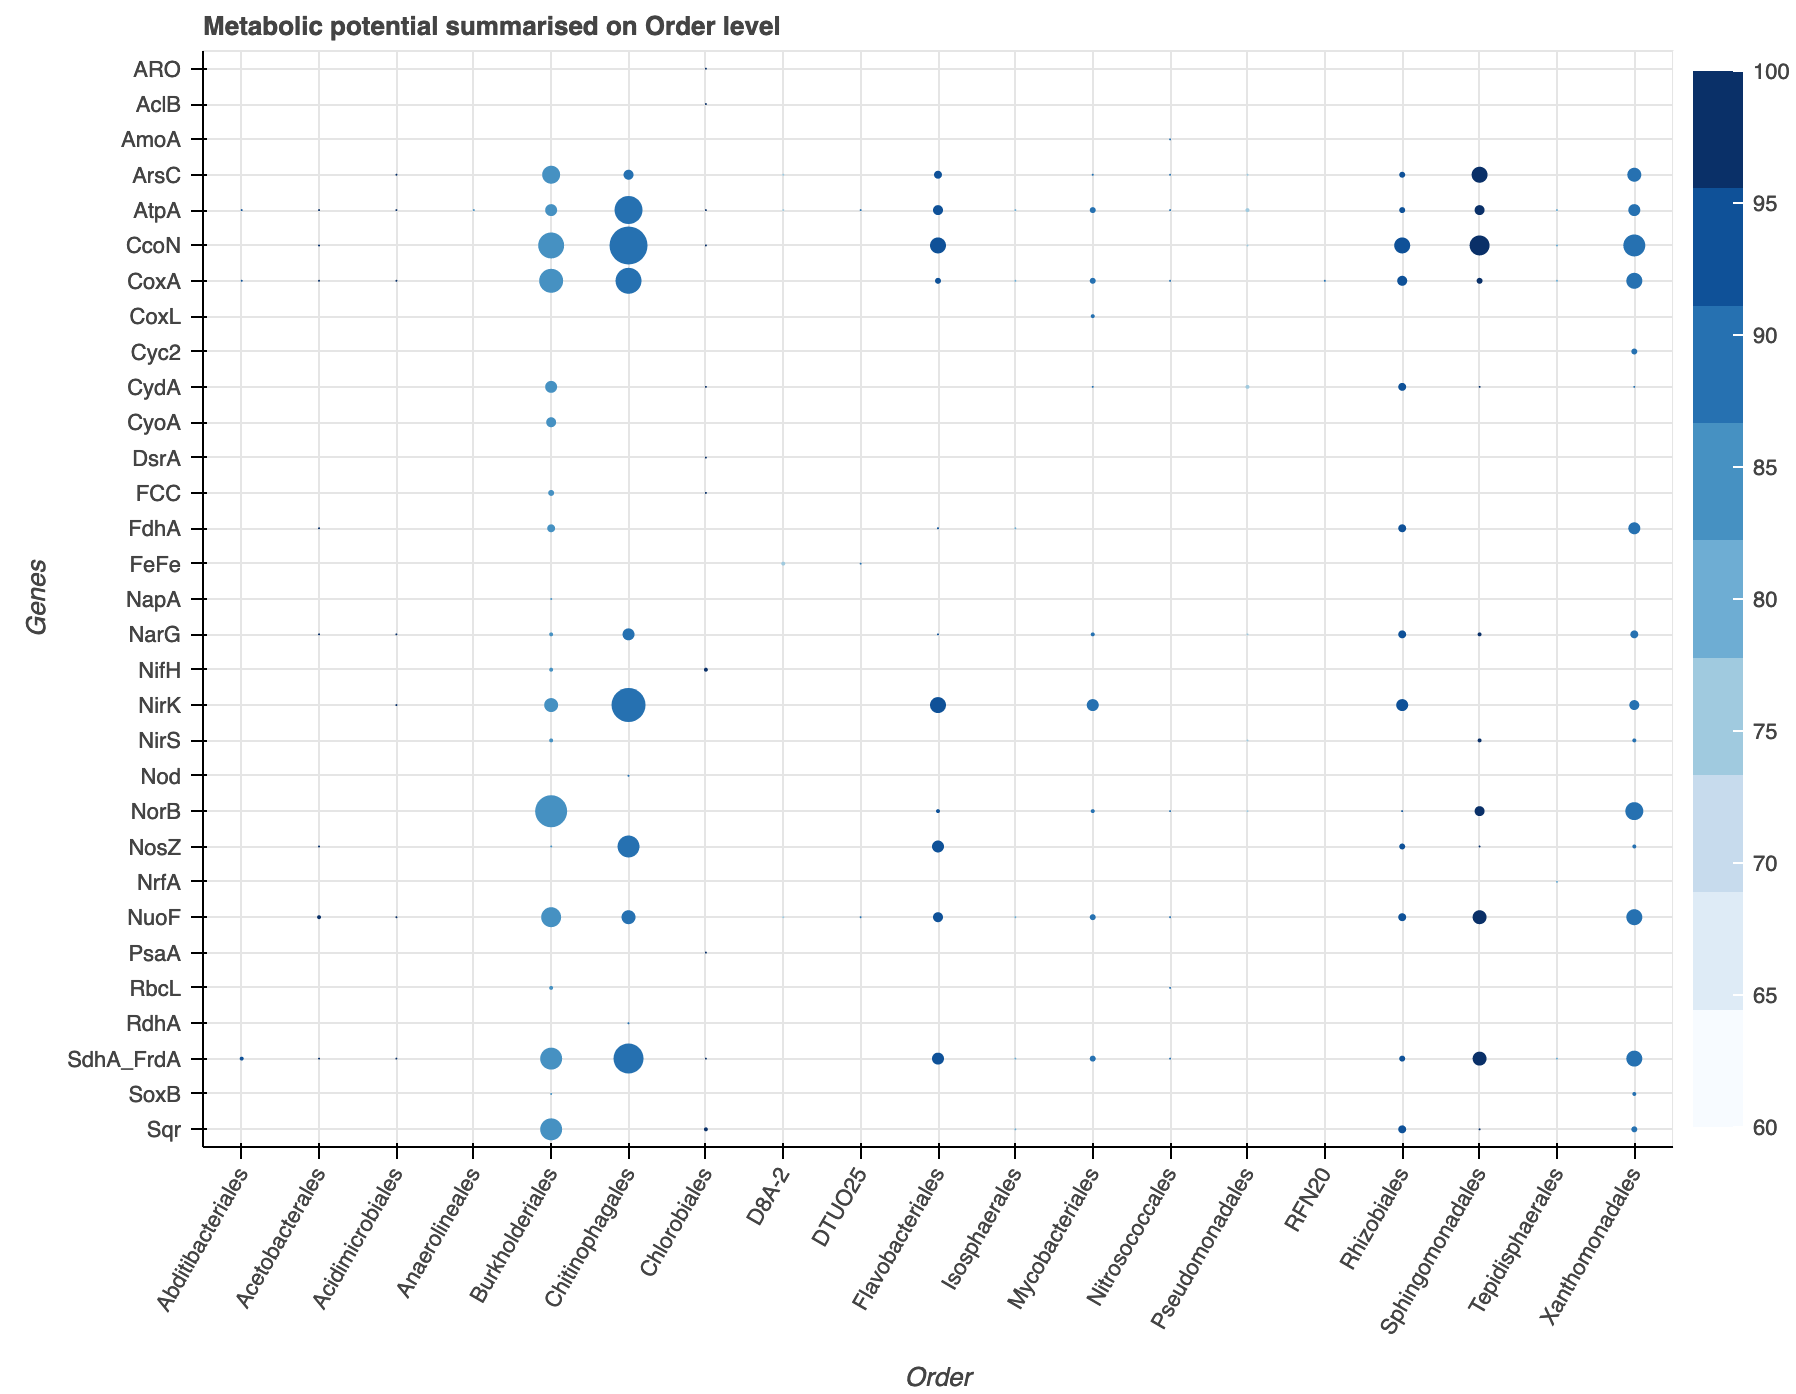
Great program, I’m asking for help in creating a plot similar to:
My codes:
import pandas as pd
import numpy as np
import math
from bokeh.palettes import Blues
from bokeh.models import LinearColorMapper, ColumnDataSource, ColorBar, Legend
from bokeh.models.ranges import FactorRange
from bokeh.plotting import figure, show
from bokeh.io import output_notebook

output_notebook()
df = c

colors = list(reversed(Blues[9]))

exp_cmap = LinearColorMapper(palette=colors,
                             low = 60,
                             high = 100)

p = figure(x_range = FactorRange(), y_range = FactorRange(), plot_width=900,
           plot_height=700, title="Metabolic potential summarised on Order level",
           toolbar_location=None, tools="hover")

p.scatter("order","gene",source=df, fill_alpha=1,  line_width=0, size="gene_count",
          fill_color={"field":"avg_comp", "transform":exp_cmap})

p.x_range.factors = sorted(df['order'].unique().tolist())
p.y_range.factors = sorted(df['gene'].unique().tolist(), reverse = True)

p.xaxis.axis_label = 'Order'
p.xaxis.major_label_orientation = math.pi/3
p.yaxis.axis_label = 'Genes'

bar = ColorBar(color_mapper=exp_cmap, location=(0,0))
p.add_layout(bar, "right")

show(p)
I want to add an legend to indicate the size of of the scatters in the plot, how can I do that?
Many thanks.
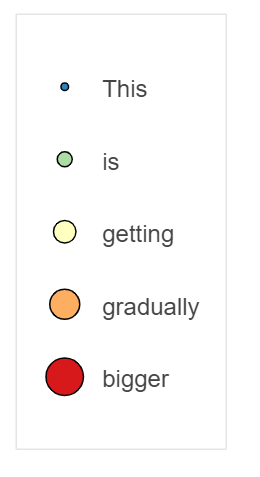
I don’t think you can with an out of the box Legend, until this either this becomes a thing → [FEATURE] GlyphLegendItem for arbitrary legend items · Issue #10776 · bokeh/bokeh · GitHub or you create separate glyphs for each size bin you create (definitely not ideal either). My hack for this has been to mimic a legend with a figure. Basically you create a glyph you want to show in the Legend, and have it point to certain fields denoting its formatting (size, color, marker etc), and make an input dict specing those along with a ‘Label’ field:
from bokeh.plotting import figure, save
from bokeh.models import Scatter, LabelSet, ColumnDataSource
from bokeh.layouts import column
from bokeh.palettes import Spectral5
import numpy as np

def genLegendFigure(input_dict,glyph):
    assert 'Label' in input_dict.keys()
    l = figure(x_range=(-3,10),y_range=(-1*len(input_dict['Label']),1))
    src = ColumnDataSource(input_dict)
    src.data['yleg'] = np.arange(len(input_dict['Label']))*-1
    glyph.x = 0
    glyph.y='yleg'
    r = l.add_glyph(src,glyph)
    lbls = LabelSet(x=0,y='yleg',text='Label',source=src,x_offset=25,y_offset=-10)
    lbl_r = l.add_layout(lbls)
    l.toolbar.logo = None
    l.toolbar_location = None
    l.xgrid.grid_line_color = None
    l.ygrid.grid_line_color = None
    l.yaxis.visible = False
    l.xaxis.visible = False
    return l

input_dict = {'size':[5,10,15,20,25],'Label':['This','is','getting','gradually','bigger']
              ,'color':Spectral5}
g = Scatter(size='size',fill_color='color') #the glyph

leg = genLegendFigure(input_dict,g)
leg.height = 300
leg.width = 150
save(leg,'dumlegend.html')
You’ll have to play with the figure sizing and label offset requirements etc to get it to jive with your figure/data. Not amazing but it has worked in a pinch for me when I need full manual control of the “legend”