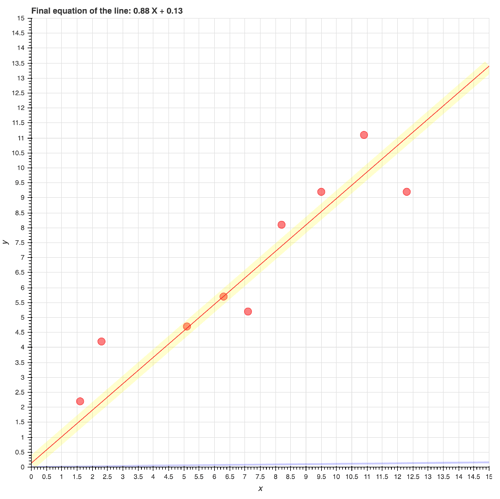
Working through some online computer science exercises, I’ve really enjoyed learning Python and Bokeh together, however, I’ve struggled now for a number of weeks to understand Bokeh callbacks. The below code represents a simple linear regression algorithm.
matrix = [
	[1.2, 1.2],
	[3, 2.5],
	[5.1, 6],
	[6.3, 4.5],
	[7.1, 5.2],
	[8.2, 8.9],
	[9, 13.8],
	[11.2, 12.1],
	[13.8, 14.2],
]
matrix = list(zip(*matrix))
training = {"x": matrix[0], "y":matrix[1]}

learning_rate = 0.0001

def update(m, b):
	# Run through all training data and update and m and b for each
	final_m = m
	final_b = b
	for i in range(len(training["x"])):
		error = calculateError(training["x"][i], training["y"][i], final_m, final_b)
		deltaM = training["x"][i] * error * learning_rate
		deltaB = error * learning_rate
		final_m += deltaM
		final_b += deltaB
	return final_m, final_b

slopeData = ColumnDataSource(data = { "gradient":[0], "y_intercept":[0] })

def callback(m, b):
	new_data = dict()
	new_data["gradient"] = m
	new_data["y_intercept"] = b
	slopeData.data = new_data

def model():
	maxIterations = 1000
	iterations = 0
	model_m = 0.01
	model_b = 0.01
	parameterRecord = []
	lossRecord = []

	p = figure(width=800, height=800,title="Fitted Data",tools="",x_range=(0,15), y_range=(0,15))
	p.xaxis.axis_label = "x"
	p.yaxis.axis_label = "y"
	p.yaxis[0].ticker.desired_num_ticks = 30
	p.xaxis[0].ticker.desired_num_ticks = 30
	p.circle(x="x", y="y", source=training, size=12, color="red", alpha=.5)

	if iterations == 0:
		initalPoints = (model_m, model_b)
	else:
		pass
	initalSlope = Slope(gradient=initalPoints[0], y_intercept=initalPoints[1], line_width=3, line_alpha=0.2, line_color="blue")
	p.add_layout(initalSlope)


	while iterations < maxIterations:
		updatedSet = update(model_m, model_b)
		parameterRecord.append(updatedSet)
		p.add_layout(Slope(gradient="gradient", y_intercept="y_intercept", source=slopeData,\
			 line_width=2, line_alpha=0.3, line_color="red", callback=callback(model_m,model_b)))
		model_m, model_b = updatedSet
		iterations += 1

	finalPoints = parameterRecord[-1]
	finalSlope = Slope(gradient=finalPoints[0], y_intercept=finalPoints[1], line_width=4, line_alpha=0.6, line_color="red")
	print("Final equation of the line: {0:.2f} X + {1:.2f}".format(finalPoints[0],finalPoints[1]))
	p.add_layout(finalSlope)

	curdoc().add_root(p)

model()
…Which ends with the error:
ValueError: expected an element of ColumnData(String, Seq(Any)), got {'gradient': 0.01, 'y_intercept': 0.01}
Are there any suggestions on how to get this code to smoothly have the slope zoom in on the slope representing the minimized error? I’ve made some of the static examples on the main bokeh site into little animations, and feel like I’m really close on this example, but just can’t figure out the last couple of steps. I apologize if there are more basic errors in my Python code but at this point I know I really need to raise my hand and ask for help.

 )
)