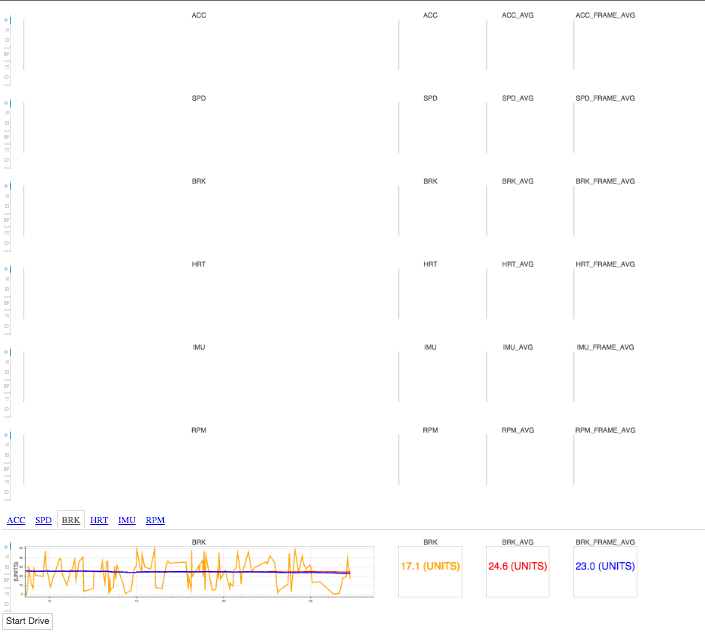
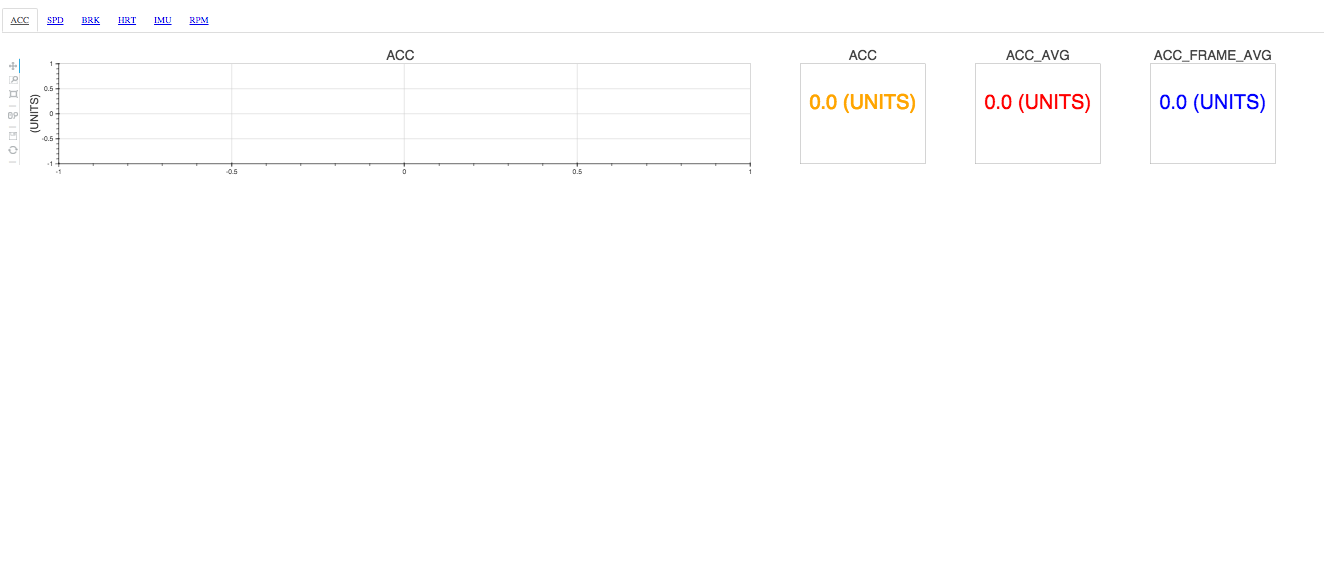
I want to create a set of panels with plots within them for a Bokeh server application I’m working on. However, when I add the panels to the Bokeh server document as “tabs”, it adds the panels and the plots within the panels to the document (where they’re supposed to be), but it creates the empty plots that are supposed to just within the panels on the Bokeh server document itself above the panels. However, the layout I want is produced when I test it by just placing the tabs on an output html file with show(tabs). Please see the attached screenshots if the explanation was unclear.
Anyone have an idea as for why this might be happening? I don’t touch curdoc() anywhere in the app before this code blurb.
Which we are still figuring out the best way to make better. In the mean time, the workaround is to use the bokeh.plotting.figure.Figure class directly, instead of the figure(...) convenience function (which auto-adds itself to the document, which is the problem). Basically, just replace any calls to "figure" with "Figure".
Bryan
···
On Mar 2, 2016, at 3:41 PM, Ricky Galliani <[email protected]> wrote:
I want to create a set of panels with plots within them for a Bokeh server application I'm working on. However, when I add the panels to the Bokeh server document as "tabs", it adds the panels and the plots within the panels to the document (where they're supposed to be), but it creates the empty plots that are supposed to just within the panels on the Bokeh server document itself above the panels. However, the layout I want is produced when I test it by just placing the tabs on an output html file with show(tabs). Please see the attached screenshots if the explanation was unclear.
Anyone have an idea as for why this might be happening? I don't touch curdoc() anywhere in the app before this code blurb.
metric_panels =
for i, list_figs in enumerate(IN_DRIVE_FIGS):
metric_panels.append(Panel(child=gridplot([list_figs]), title=list_figs[0].title))
Which we are still figuring out the best way to make better. In the mean time, the workaround is to use the bokeh.plotting.figure.Figure class directly, instead of the figure(…) convenience function (which auto-adds itself to the document, which is the problem). Basically, just replace any calls to “figure” with “Figure”.
Bryan
Hey Bryan,
Thanks for the reply. The linked issue seems to be the same problem. Unfortunately, the figure() → Figure() workaround doesn’t seem to work for me. Do you see anything majorly wrong with just clearing everything from the document with a call to clear() before I call curdoc().add_root(tabs)?
-Ricky G
···
On Wednesday, March 2, 2016 at 2:15:19 PM UTC-8, Bryan Van de ven wrote:
I want to create a set of panels with plots within them for a Bokeh server application I’m working on. However, when I add the panels to the Bokeh server document as “tabs”, it adds the panels and the plots within the panels to the document (where they’re supposed to be), but it creates the empty plots that are supposed to just within the panels on the Bokeh server document itself above the panels. However, the layout I want is produced when I test it by just placing the tabs on an output html file with show(tabs). Please see the attached screenshots if the explanation was unclear.
Anyone have an idea as for why this might be happening? I don’t touch curdoc() anywhere in the app before this code blurb.
Because I don’t add anything to the Bokeh serve document before my call to curdoc().add_root(tabs), I think I’ll just go with that unless you have some other advice.
···
On Wednesday, March 2, 2016 at 1:41:51 PM UTC-8, Ricky Galliani wrote:
I want to create a set of panels with plots within them for a Bokeh server application I’m working on. However, when I add the panels to the Bokeh server document as “tabs”, it adds the panels and the plots within the panels to the document (where they’re supposed to be), but it creates the empty plots that are supposed to just within the panels on the Bokeh server document itself above the panels. However, the layout I want is produced when I test it by just placing the tabs on an output html file with show(tabs). Please see the attached screenshots if the explanation was unclear.
Anyone have an idea as for why this might be happening? I don’t touch curdoc() anywhere in the app before this code blurb.
Which we are still figuring out the best way to make better. In the mean time, the workaround is to use the bokeh.plotting.figure.Figure class directly, instead of the figure(...) convenience function (which auto-adds itself to the document, which is the problem). Basically, just replace any calls to "figure" with "Figure".
Bryan
Hey Bryan,
Thanks for the reply. The linked issue seems to be the same problem. Unfortunately, the figure() -> Figure() workaround doesn't seem to work for me. Do you see anything majorly wrong with just clearing everything from the document with a call to clear() before I call curdoc().add_root(tabs)?
-Ricky G
> On Mar 2, 2016, at 3:41 PM, Ricky Galliani <[email protected]> wrote:
>
> I want to create a set of panels with plots within them for a Bokeh server application I'm working on. However, when I add the panels to the Bokeh server document as "tabs", it adds the panels and the plots within the panels to the document (where they're supposed to be), but it creates the empty plots that are supposed to just within the panels on the Bokeh server document itself above the panels. However, the layout I want is produced when I test it by just placing the tabs on an output html file with show(tabs). Please see the attached screenshots if the explanation was unclear.
>
> Anyone have an idea as for why this might be happening? I don't touch curdoc() anywhere in the app before this code blurb.
>
> metric_panels =
> for i, list_figs in enumerate(IN_DRIVE_FIGS):
> metric_panels.append(Panel(child=gridplot([list_figs]), title=list_figs[0].title))
>
> tabs = Tabs(tabs = metric_panels)
>
> # (Weird output)
> curdoc().add_root(tabs)
>
> # (Expected output)
> # output_file("test.html")
> # show(tabs)
>
>
> --
> You received this message because you are subscribed to the Google Groups "Bokeh Discussion - Public" group.
> To unsubscribe from this group and stop receiving emails from it, send an email to bokeh+un...@continuum.io.
> To post to this group, send email to bo...@continuum.io.
> To view this discussion on the web visit https://groups.google.com/a/continuum.io/d/msgid/bokeh/4b960d3e-5958-45cc-9689-1820965ddd08%40continuum.io\.
> For more options, visit https://groups.google.com/a/continuum.io/d/optout\.
> <Screen Shot 2016-03-02 at 1.40.40 PM.png><Screen Shot 2016-03-02 at 1.41.28 PM.png>
On Wednesday, March 2, 2016 at 1:41:51 PM UTC-8, Ricky Galliani wrote:
I want to create a set of panels with plots within them for a Bokeh server application I’m working on. However, when I add the panels to the Bokeh server document as “tabs”, it adds the panels and the plots within the panels to the document (where they’re supposed to be), but it creates the empty plots that are supposed to just within the panels on the Bokeh server document itself above the panels. However, the layout I want is produced when I test it by just placing the tabs on an output html file with show(tabs). Please see the attached screenshots if the explanation was unclear.
Anyone have an idea as for why this might be happening? I don’t touch curdoc() anywhere in the app before this code blurb.