from bokeh.plot_object import PlotObject
from bokeh.server.utils.plugins import object_page
from bokeh.server.app import bokeh_app
from bokeh.plotting import curdoc, cursession
from bokeh.crossfilter.models import CrossFilter
import pandas as pd
IFDATA = pd.read_csv("file:///h:/Network Planning/MPLS/MATE/InterfaceTraffic
.txt")
IFDATA.dtypes
Time object
Node object
Interface object
Queue object
TraffMeas float64
Capacity float64
dtype: object
IFDATA.shape
(68640, 6)
for col in IFDATA.columns:
… print(str(IFDATA[col].describe())+ ‘\n’)
…
count 68640
unique 96
top 150724 18:35:00
freq 715
Name: Time, dtype: object
count 68640
unique 24
top SIO3-7750SRC12
freq 7776
Name: Node, dtype: object
count 68640
unique 79
top to-KDC2-1/3/1
freq 1728
Name: Interface, dtype: object
count 68640
unique 9
top 0
freq 8736
Name: Queue, dtype: object
count 68640.000000
mean 4.084574
std 44.898229
min 0.000000
25% 0.000000
50% 0.000000
75% 0.000000
max 1265.050000
Name: TraffMeas, dtype: float64
count 68640.000000
mean 3488.171860
std 3617.407471
min 0.000000
25% 1000.000000
50% 1950.000000
75% 2950.000000
max 10000.000000
Name: Capacity, dtype: float64
---------- Forwarded message ----------
From: “Nick Roth” [email protected]
Date: Jul 30, 2015 9:54 PM
Subject: Re: Crossfilter issues with bokeh-server
To: “Stephen LaRoy” [email protected]
Cc: “Bokeh Discussion - Public” [email protected]
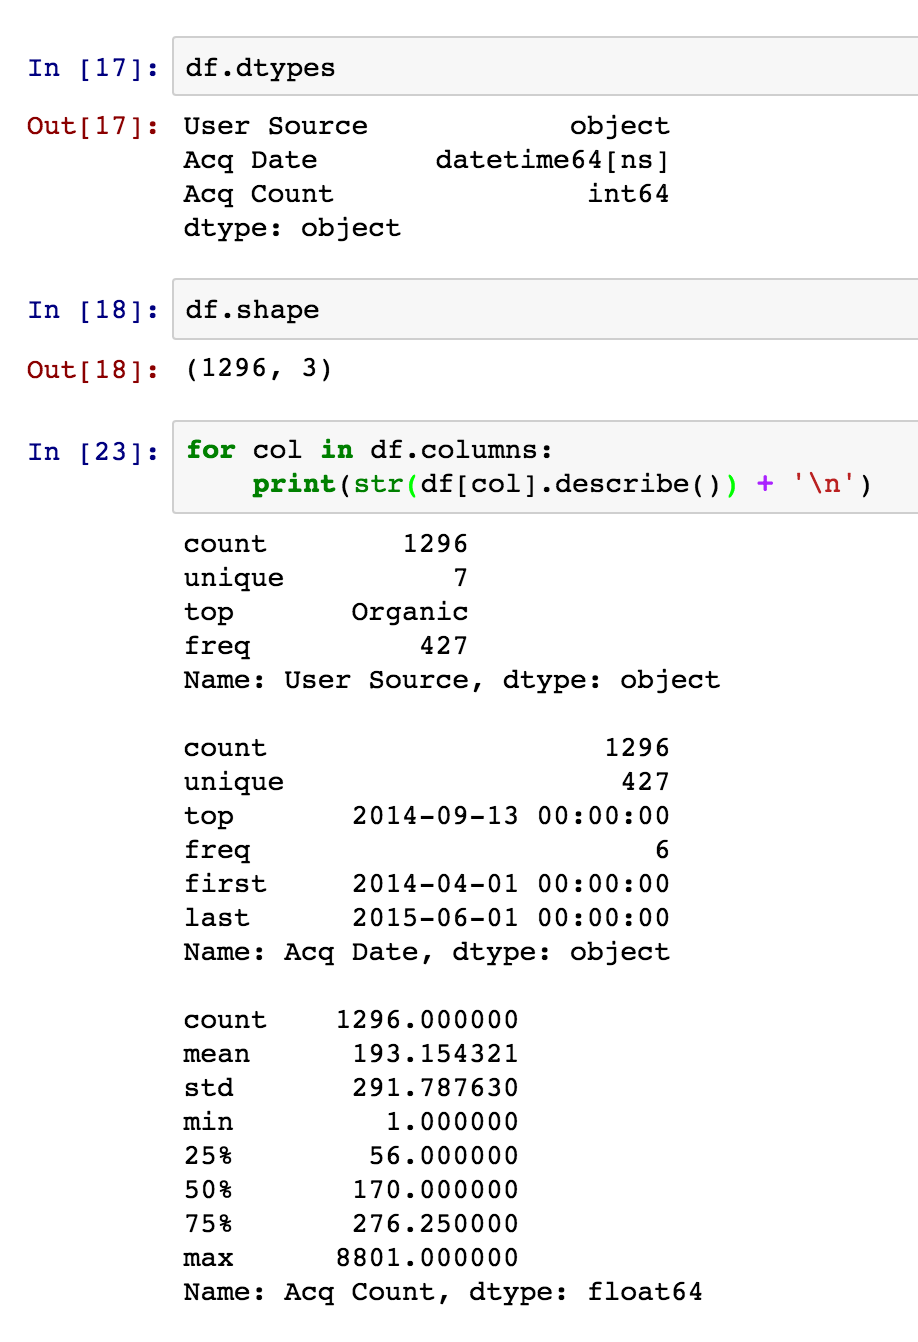
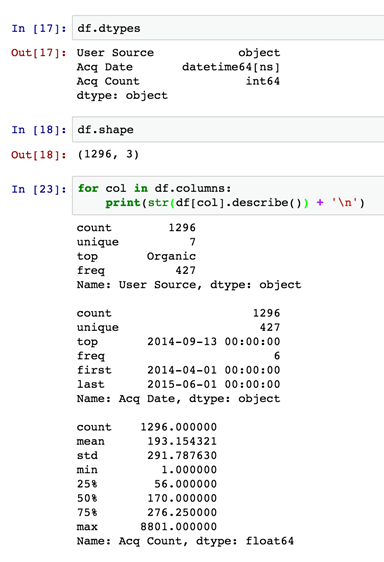
Right, yeah then the easiest thing to do would be to make the data anonymous, or make a representative data set that we can test. The key thing is what kind of numerical data, integers, floats, many distinct values? few? How many rows, how many columns etc. I added an image of summarizing these details from a pandas dataframe. Ultimately, I don’t think crossfilter is handling dates in a special way, and definitely isn’t changing the level of detail dynamically.
On Thu, Jul 30, 2015 at 11:36 PM, Stephen LaRoy [email protected] wrote:
Thanks for the reply, Nick.
I have two columns of numerical data in addition to the strings, and these seem to get imported fine without typing them as a string.
I’d be happy to help in the profiling this particular dataset, but unfortunately since it is work data I can’t give it out. Do you have any instructions on how to run the profiler?
It sounds like a cool project to dive into, but unfortunately it was sort of a side-bar project to see if I could get something interesting running without too much development. It did help me quickly spot a problem with the data, which was handy, but my other responsibilities at work will keep me from fiddling too much more with this (which would be fun).
Cheers,
Steve
On Thu, Jul 30, 2015 at 8:21 PM, Nick Roth [email protected] wrote:
Hi, yeah I have noticed that crossfilter can be kind of slow at times, based on data and selections. The thing I’d suggest is either seeing if you can profile the app on your data to see what is taking the longest, or providing the data set. It would be difficult to know how to make it faster without the data, but can say that crossfilter won’t work as is with bokehjs only.
One thing I notice is that all of your columns that I see are strings. Do you have numerical data as well, or only those 4 columns? The crossfilter type of application is more meant for the cases where you have multiple dimensions, and multiple measures.
The downsampling is not something that will happen automatically, but you can definitely dive into CrossFilter and its associated plug-ins to understand how you would modify the behavior. I attempted to abstract all of the chart-specific functionality into the plugins, so someone could come along and integrate their own chart type. The plugin receives what the user selected for the x and y columns, then creates a figure with those settings. You are free to do anything you want to that figure.
On Wednesday, July 29, 2015 at 1:53:27 PM UTC-5, [email protected] wrote:
Hi,
I was able to get the sample crossfilter example working with bokeh-server and my own data set… very cool!
from bokeh.plot_object import PlotObject
from bokeh.server.utils.plugins import object_page
from bokeh.server.app import bokeh_app
from bokeh.plotting import curdoc, cursession
from bokeh.crossfilter.models import CrossFilter
import pandas as pd
IFDATA = pd.read_csv(“file:///h:/path/to/file.txt”)
@bokeh_app.route(“/bokeh/crossfilter/”)
@object_page(“crossfilter”)
def make_crossfilter():
IFDATA[‘Node’] = IFDATA[‘Node’].astype(str)
IFDATA[‘Interface’] = IFDATA[‘Interface’].astype(str)
IFDATA[‘Queue’] = IFDATA[‘Queue’].astype(str)
IFDATA[‘Time’] = IFDATA[‘Time’].astype(str)
app = CrossFilter.create(df=IFDATA)
return app
Unfortunately, the data set is larger than 60k lines (for one day!), so I have a couple of problems:
- The refresh rate when changing between filters and x/y sources is super slow, and the browser seems to hang every time I change a setting.
- The server downsamples my 96 time intervals into only 4, so I lose granularity in the data. Zooming in doesn’t cause the data to be displayed at the correct intervals.
Is there some way to make a crossfilter solely in bokehjs without the bokeh-server backend? Would that make it faster? This wasn’t evident from the documentation.
Is there a way to set the server down-sampling settings so that zooming in restores the correct data to 15-minute intervals instead of 6-hour intervals? The downsampling section on the user guide is suspiciously empty.
Thanks!
This email and its attachments are intended solely for the personal use of the individual or entity named above. Any use of this communication by an unintended recipient is strictly prohibited. If you have received this email in error, any publication, use, reproduction, disclosure or dissemination of its contents is strictly prohibited. Please immediately delete this message and its attachments from your computer and servers. We would also appreciate if you would contact us by a collect call or return email to notify us of this error. Thank you for your cooperation.
-BCHydroDisclaimerID5.2.8.1541