Hello,
I’ve a little issue to use the hover on a histogram plot with javascript.
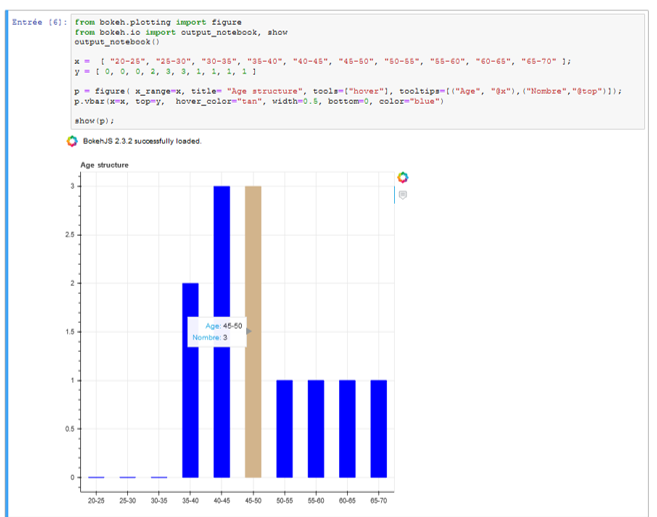
Here a code I would like to put on a nodejs frontend:
from bokeh.plotting import figure
from bokeh.io import output_notebook, show
output_notebook()
x = [ “20-25”, “25-30”, “30-35”, “35-40”, “40-45”, “45-50”, “50-55”, “55-60”, “60-65”, “65-70” ];
y = [ 0, 0, 0, 2, 3, 3, 1, 1, 1, 1 ]
p = figure( x_range=x, title= “Age structure”, tools=[“hover”], tooltips=[(“Age”, “@x”),(“Nombre”,“@top”)]);
p.vbar(x=x, top=y, hover_color=“tan”, width=0.5, bottom=0, color=“blue”)
show(p);
‘’’
It works without problem on my notebook with python.
But on my frontend server with javascript, despite a tooltips parameter in the figure function → Bokeh.Plotting.figure(), the figure only show the default tooltip hover.
Here my code: https://codepen.io/VivienD/pen/OJpjBwQ
Python code and javascript code are barely the sames.
It appears an issue on this line in the javascript/html version.
var p = Bokeh.Plotting.figure(…);
To resolve that:
-I thought to this python code:
p.add_tools(HoverTool(
tooltips=[( … )]
))
But I don’t know how to import HoverTool function in javascript.
-I also know it can be resolved with a python backend/flask server (json_item → embed doc), but I rather not add python code to my project.
Thanks,
Vivien.