I have a line chart with multiple trends in it.
Each trend has corresponding point too.
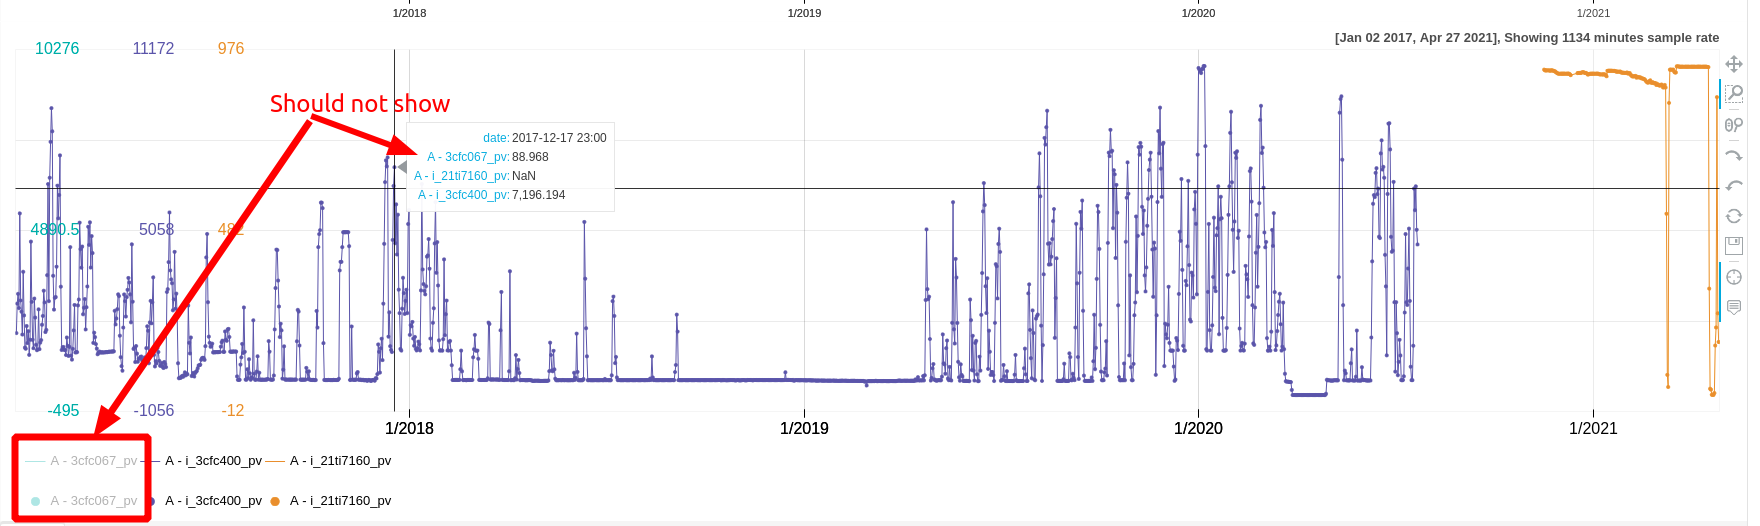
I am aiming to get a hover tool like this:

I have achieved it using this code:
def add_tags_hover_tool(fig: figure, tags: List):
    tags_data = []
    for var in tags:
        if should_not_show(var):
            continue
        tags_data.append((var, '@{' + var + "}{0,0.000}"))
    hover = HoverTool(tooltips=[('date', '@timestamp{%Y-%m-%d %H:%M}')] + tags_data,
                      formatters={'@timestamp': 'datetime'},
                      mode='mouse')
    fig.add_tools(hover)
I want the hovertool to show non-hidden glyphs;