Custom tools【CustomAction】

I am currently working on a visualization and data marking project, and I have encountered some problems that I hope to discuss with you.

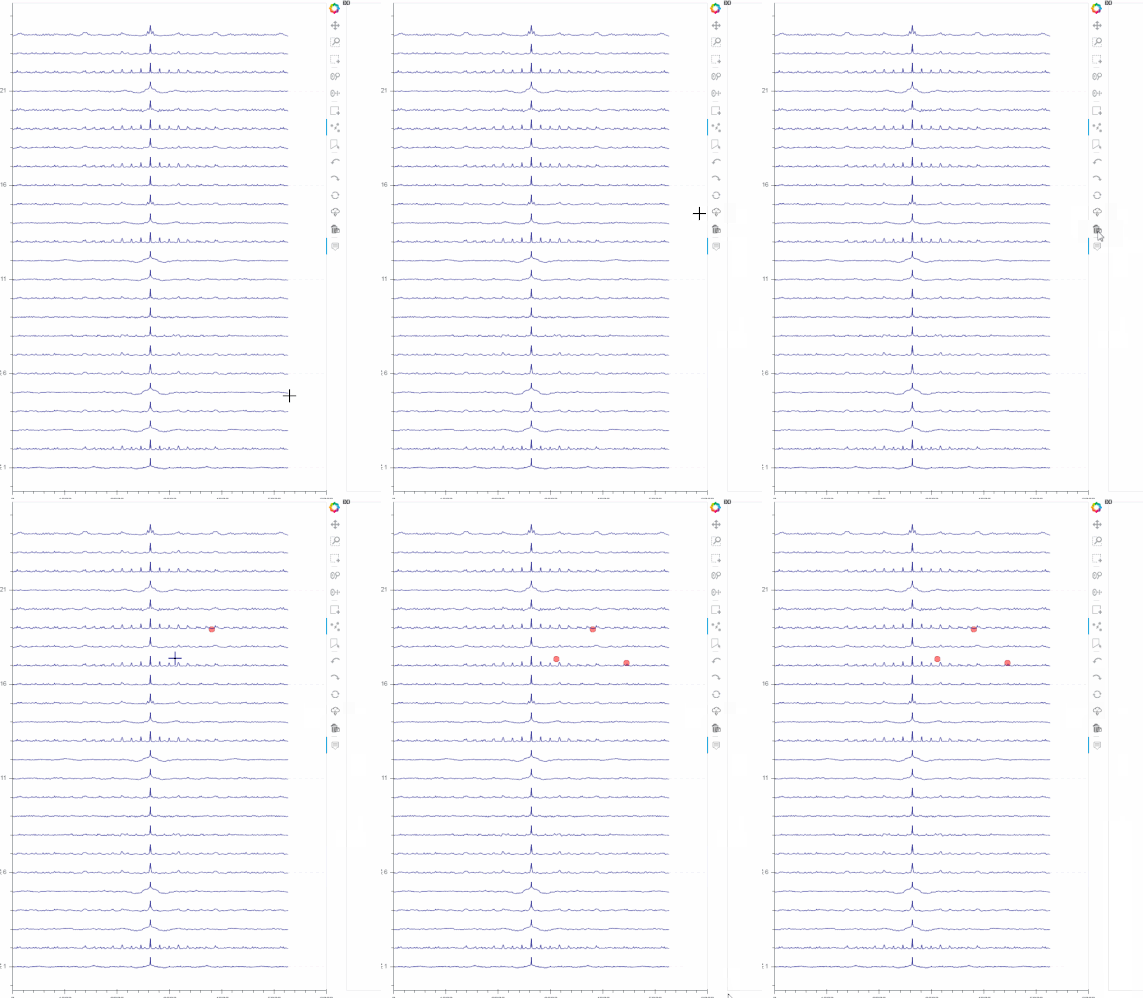
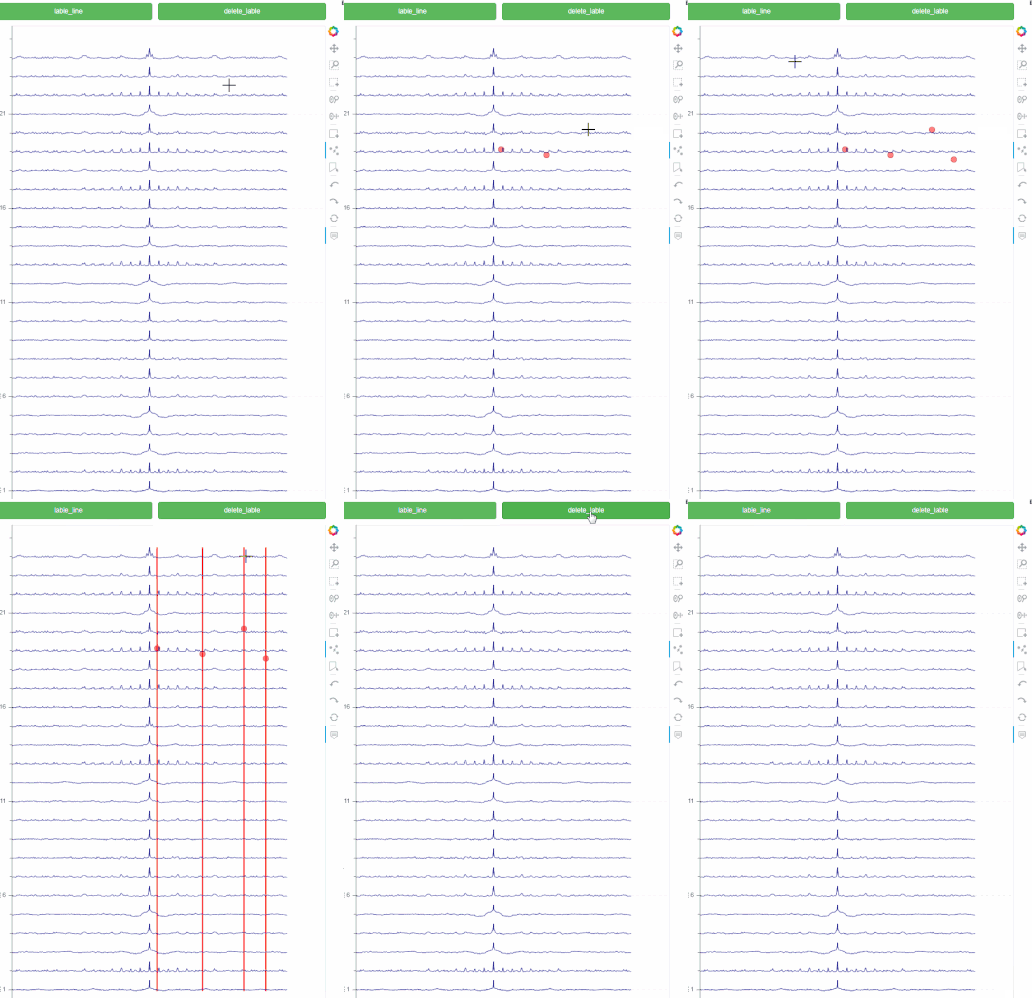
First question: I use the button to implement two functions (vertical markup and deletion of all markup), as shown in Figure 1. Now I want to put it in the toolbar, as shown in Figure 2, but it doesn’t work when I click on the icon. What can I do about it?

Second question: The vertical markup I implemented in Figure 1 is using the PointDrawTool and PolyDrawTool. Is there a simpler way, for example, when I double-click on a data, the vertical line will appear?

Thank you !


Figure 1


Figure 2

Delete function in Figure 1

button_delete_lable = Button(label="delete_lable", button_type="success",width=1250) 
def delete_lable():
    table1.source.data = {'x': [], 'y': [], 'disease': []}
    table2.source.data = {'x': [], 'y': [], 'disease': []}
    table3.source.data = {'x': [], 'y': [], 'disease': []}    
    source_toline1.data = {'x': [], 'y': []}
    source_toline2.data = {'x': [], 'y': []}
    source_toline3.data = {'x': [], 'y': []}        
    src1.data = {'x': [], 'y': [], 'width': [], 'height': [], 'disease': []}
    src2.data = {'x': [], 'y': [], 'width': [], 'height': [], 'disease': []}
    src3.data = {'x': [], 'y': [], 'width': [], 'height': [], 'disease': []}
button_delete_lable.on_click(delete_lable) 

CustomAction in Figure 2
I use py2js to convert Python functions to JS

lable_line_js = py2js(lable_line)
delete_lable_js = py2js(delete_lable)

Custom_lable_line = CustomAction(action_tooltip = " lable_line ",
                    icon = "line.png",
                    callback = CustomJS(code = lable_line_js ))
p_line1.add_tools(Custom_lable_line)


Custom_delete_lable = CustomAction(action_tooltip = " delete_lable ",
                    icon = "delete.png",
                    callback = CustomJS(code = delete_lable_js ))
p_line1.add_tools(Custom_delete_lable)

@Levin I don’t have py2js installed. Please post the actual JS code that you are configuring the CustomAction with. In the mean time, a few other helpful notes:

  • In BokehJS, there is a ColumnDataSource.clear() method that will empty all the current columns in a CDS

  • English spelling is “label” (not “lable”)

  • You could use Span annotations or Segment (or any line-like glyph, really) to draw the vertical lines instead. The data for those could be updated by tap events, or selectction changes, etc.

Thank you for pointing out my mistakes. Sorry, I am not good at writing JS code. At present, I can only use pscript module to translate Python code.

from pscript import py2js
delete_lable_js = py2js(delete_lable)
print(delete_lable_js)

The translation results are as follows:

var delete_lable;
delete_lable = function flx_delete_lable () {
    table1.source.data = ({x: [], y: [], disease: []});
    table2.source.data = ({x: [], y: [], disease: []});
    table3.source.data = ({x: [], y: [], disease: []});
    source_toline1.data = ({x: [], y: []});
    source_toline2.data = ({x: [], y: []});
    source_toline3.data = ({x: [], y: []});
    src1.data = ({x: [], y: [], width: [], height: [], disease: []});
    src2.data = ({x: [], y: [], width: [], height: [], disease: []});
    src3.data = ({x: [], y: [], width: [], height: [], disease: []});
    return null;
};

I don’t see anything amiss offhand. The best thing would be to provide a complete minimal example that demonstrates things, so that I can run it directly and investigate. Otherwise, are there any errors reported in the browsers JavaScript console?

Here’s the complete code:

1 .Button

import os
import random
import numpy as np
import pandas as pd
from bokeh.io import curdoc
from bokeh.models import Panel,ColumnDataSource, CustomAction,CustomJS,RangeTool,MultiLine,FuncTickFormatter,HoverTool, Select, TextInput, Button, Paragraph, PreText,DataTable, TableColumn, PointDrawTool,BoxEditTool,PolyDrawTool,LinearAxis
from bokeh.plotting import figure
from bokeh.layouts import column, row
from pscript import py2js

hover = HoverTool(tooltips=[
                        ("index", "$index"),
                        ("(x,y)", "($x, $y)"),
                    ])
tools_slef=[hover,'box_select,xwheel_zoom,xpan,xwheel_pan,undo,redo,reset']
p_line1 = figure(tools=tools_slef,plot_width=800, plot_height=600, x_range=(0, 100))

# 1.1 #
source_table1 = ColumnDataSource({'x': [], 'y': []})
renderer_table1 = p_line1.scatter(
    x='x', y='y', source=source_table1, color='red', size=10)

draw_table1 = PointDrawTool(renderers=[renderer_table1], empty_value=0)
p_line1.add_tools(draw_table1)
p_line1.toolbar.active_tap = draw_table1

# 1.2 #
source_toline1 = ColumnDataSource(dict(
    x=[],
    y=[],
)
)
glyph_MultiLine = MultiLine(xs="x", ys="y", line_color="red", line_width=2)
p1 = p_line1.add_glyph(source_toline1, glyph_MultiLine)
draw_line1 = PolyDrawTool(renderers=[p1])
p_line1.add_tools(draw_line1)

# 1.3 #
src1 = ColumnDataSource({
    'x': [],
    'y': [],
    'width': [],
    'height': [],
})

renderer_line1 = p_line1.rect('x',
                              'y',
                              'width',
                              'height',
                              source=src1,
                              alpha=0.3,
                              color='red'
                              )

draw_box1 = BoxEditTool(renderers=[renderer_line1], empty_value=0)
p_line1.add_tools(draw_box1)


x1 = np.linspace(0,99, 100)
y1 = np.array([random.randint(-10,10) for _ in range(100)])
source_line1 = ColumnDataSource(data=dict(x=x1,y=y1))
p_line1.line('x', 'y', line_color="navy",line_width=1, source=source_line1)

line1_min = source_line1.data["y"].min()
line1_max = source_line1.data["y"].max()
button_label_line = Button(label="label_line", button_type="success",width=400) 
def label_line():
        x_line1 = source_table1.data["x"]       
        len_x_line1 = len(x_line1)
        x_lines1 = [[x_line1[i],x_line1[i]] for i in range(len_x_line1)]
        y_lines1 = [[line1_min,line1_max] for i in range(len_x_line1)]

        source_toline1.data = {'x': x_lines1, 'y': y_lines1}
button_label_line.on_click(label_line)

button_delete_label = Button(label="delete_label", button_type="success",width=400) 
def delete_label():
    # source_table1.clear() 
    # source_toline1.clear() 
    # src1.clear() 
    source_table1.data = {'x': [], 'y': []}  
    source_toline1.data = {'x': [], 'y': []}      
    src1.data = {'x': [], 'y': [], 'width': [], 'height': []}
button_delete_label.on_click(delete_label) 

curdoc().add_root(column(row(button_label_line,button_delete_label),p_line1))

2.CustomAction

import os
import random
import numpy as np
import pandas as pd
from bokeh.io import curdoc
from bokeh.models import Panel,ColumnDataSource, CustomAction,CustomJS,RangeTool,MultiLine,FuncTickFormatter,HoverTool, Select, TextInput, Button, Paragraph, PreText,DataTable, TableColumn, PointDrawTool,BoxEditTool,PolyDrawTool,LinearAxis
from bokeh.plotting import figure
from bokeh.layouts import column, row
from pscript import py2js

hover = HoverTool(tooltips=[
                    ("index", "$index"),
                    ("(x,y)", "($x, $y)"),
                ])
tools_slef=[hover,'box_select,xwheel_zoom,xpan,xwheel_pan,undo,redo,reset']
p_line1 = figure(tools=tools_slef,plot_width=800, plot_height=600, x_range=(0, 100))

# 1.1 #
source_table1 = ColumnDataSource({'x': [], 'y': []})
renderer_table1 = p_line1.scatter(
    x='x', y='y', source=source_table1, color='red', size=10)

draw_table1 = PointDrawTool(renderers=[renderer_table1], empty_value=0)
p_line1.add_tools(draw_table1)
p_line1.toolbar.active_tap = draw_table1

# 1.2 #
source_toline1 = ColumnDataSource(dict(
    x=[],
    y=[],
)
)
glyph_MultiLine = MultiLine(xs="x", ys="y", line_color="red", line_width=2)
p1 = p_line1.add_glyph(source_toline1, glyph_MultiLine)
draw_line1 = PolyDrawTool(renderers=[p1])
p_line1.add_tools(draw_line1)

# 1.3 #
src1 = ColumnDataSource({
    'x': [],
    'y': [],
    'width': [],
    'height': [],
})

renderer_line1 = p_line1.rect('x',
                              'y',
                              'width',
                              'height',
                              source=src1,
                              alpha=0.3,
                              color='red'
                              )

draw_box1 = BoxEditTool(renderers=[renderer_line1], empty_value=0)
p_line1.add_tools(draw_box1)


x1 = np.linspace(0,99, 100)
y1 = np.array([random.randint(-10,10) for _ in range(100)])

source_line1 = ColumnDataSource(data=dict(x=x1,y=y1))
p_line1.line('x', 'y', line_color="navy",line_width=1, source=source_line1)

line1_min = source_line1.data["y"].min()
line1_max = source_line1.data["y"].max()

def label_line():
        x_line1 = source_table1.data["x"]       
        len_x_line1 = len(x_line1)
        x_lines1 = [[x_line1[i],x_line1[i]] for i in range(len_x_line1)]
        y_lines1 = [[line1_min,line1_max] for i in range(len_x_line1)]

        source_toline1.data = {'x': x_lines1, 'y': y_lines1}

def delete_label():
    # source_table1.clear() 
    # source_toline1.clear() 
    # src1.clear() 
    source_table1.data = {'x': [], 'y': []}  
    source_toline1.data = {'x': [], 'y': []}      
    src1.data = {'x': [], 'y': [], 'width': [], 'height': []}

lable_line_js = py2js(label_line)
delete_lable_js = py2js(delete_label)

Custom_lable_line = CustomAction(action_tooltip = " lable_line ",
                    icon = "line.png",
                    callback = CustomJS(code = lable_line_js ))
p_line1.add_tools(Custom_lable_line)

Custom_delete_lable = CustomAction(action_tooltip = " delete_lable ",
                    icon = "delete.png",
                    callback = CustomJS(code = delete_lable_js ))
p_line1.add_tools(Custom_delete_lable)

curdoc().add_root(p_line1)
You are not passing an args dict argument to CustomJS. The JavaScript runtime does not know anything at all about Python variables like source. You can only manipulate the corresponding JavaScript objects. Bokeh makes it easy to get ahold of these by specifying the objects you need in the args dict. There are lots of example of this in the docs.

Also I would really advise against using py2js. The JS code it produces is really terrible, you can’t insert debugger statements in the output easily, and most importantly, it really obscures fundamental important distictions, e.g. that the pytho objects don’t exist on the JavaScript side.

Thank you for your advice. I rewrote the code with JS. Although it took some time, I finally realized the above functions.

Hello, I found another problem today. I hope to get your guidance.
line1_min and line1_max in update_input1_data() are not updated to Custom_label_line. So line1_min and line1_max in code is always an empty list.

global source_line1
source_line1 = ColumnDataSource(data=dict(x=[0]))   
line1_min = []
line1_max = []

def update_input1_data(attrname, old, new):
        x1 = np.linspace(0,slt_strc_DF1.shape[0]-1, slt_strc_DF1.shape[0])
        nums = list(slt_strc_DF1.keys())
        nums_str1 = [str(x) for x in nums] 

        source_line1 = ColumnDataSource(data=dict(x=x1))
        for i, num in enumerate(nums_str1):
            source_line1.add(slt_strc_DF1[i], num)
            p_line1.line('x', num, line_color="navy",line_width=1, source=source_line1)
        global line1_min
        global line1_max        
        line1_min = source_line1.data[nums_str1[0]].min()
        line1_max = source_line1.data[nums_str1[-1]].max()
select_strce_1.on_change('value', update_input1_data)   

Custom_label_line = CustomAction(action_tooltip=" label_line ",icon="vertical.png",
                                callback=CustomJS(
                                    args=dict(
                                        line1_min = line1_min,
                                        line1_max = line1_max,                                       
                                        source_table1 = source_table1, 
                                        source_toline1 = source_toline1), 
                                    code="""
        x_line1 = source_table1.data["x"];
        len_x_line = x_line1.length;

        var x_lines_2 = new Array();
        for(var i=0;i<len_x_line;i++){       
            x_lines_2[i] = new Array();
            x_lines_2[i][0] = x_lines[i];
            x_lines_2[i][1] = x_lines[i];
        }
        var y_lines1 = new Array();
        for(var i=0;i<len_x_line;i++){       
            y_lines1[i] = new Array();
            y_lines1[i][0] = line1_min;
            y_lines1[i][1] = line1_max;               
        }  
        source_toline1.data['x'] = x_lines_2;
        source_toline1.data['y'] = y_lines1;
        source_toline1.change.emit();
    """))
p_line1.add_tools(Custom_label_line)

Only Bokeh object (or collections of Bokeh objects) can be passed it he args dict. For simple basic types, I have seen people use string formatting to insert the values in to the JS code, e.g:

JS__CODE = """

    y_lines1[i][0] = %s
    y_lines1[i][1] = %s

""" % (line1_min, line1_max)

Thank you! I try to solve this problem in the following way.

global source_test
source_test = ColumnDataSource()
table_test = DataTable(source=source_test)

def update_input1_data(attrname, old, new):
        ...
        source_test.add([line1_min], "line1_min")
        source_test.add([line1_max], "line1_max")

JS_CODE = """  
        y_lines1[i][0] = source_test.data["line1_min"];
        y_lines1[i][1] = source_test.data["line1_max"]; 
          """