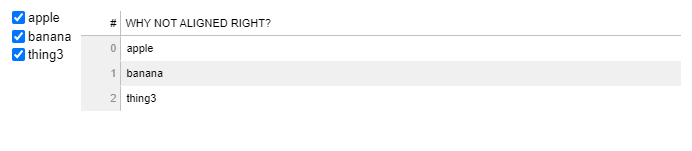
I tried this code that gmerritt posted here on the discourse. I dont get a customized header. Looks like this when I plot the code below:
Anyone know how to customize a datatables in bokeh? Unable to change font, nothing works for me from what I have tried.
from bokeh.models.widgets import DataTable, TableColumn
from bokeh.models import CheckboxGroup, ColumnDataSource
from jinja2 import Template
from bokeh.embed import components
from bokeh.resources import Resources
from bokeh.layouts import layout

#make dummy stuff
data = {'things':['apple','banana','thing3']}
src=ColumnDataSource(data)
cbg = CheckboxGroup(labels=data['things'],active=[0,1,2]
                    ,css_classes=['cbstyle'] ##???? probably not doing this right? do
                    )
col = TableColumn(field='things',title='WHY NOT ALIGNED RIGHT?')
tbl = DataTable(source=src,columns=[col])
#put em together in a layout
lo = layout([[cbg,tbl]])
#break into script and div componenents
script,div = components(lo)

#some of this schtuff works, some of it doesn't...
css_stuff = '''
                <style>
                  .slick-header-columns {
                    background-color: #17648D !important;
                    font-family: arial;
                    font-weight: bold;
                    font-size: 12pt;
                    color: #FFFFFF;
                    text-align: right;
                    }
                  .slick-row{
                    font-size: 8pt;
                    font-family: arial;
                    text-align: right;
                    }
                  .cbstyle{
                      font-size: 45pt;
                      background: red;
                      }
                </style>
            '''

tpl = Template('''<!DOCTYPE html>
        <html lang="en">
            <head>
                <meta charset="utf-8">
                <title>'''+'Here is a title'+'''</title>
                {{ resources }}
                {{ script }}
                '''+css_stuff+'''
            </head>
            <body>
                <div>
                {{ div }}
                </div>
            </body>
        </html>
        ''')
resources = Resources().render()
html = tpl.render(resources=resources,script=script,div=div)
with open('test.html', mode="w", encoding="utf-8") as f:
    f.write(html)