CustomJS callback for select widgets to update scatter plot with streamlit

Hi, I am new to bokeh applications with streamlit. I am trying to use customJS callback to update my plot if there is any change in the select widgets. I made up the following code and unfortunately plot is not updating after the change in select value.
here is the code snippet:

plot_data = my_total_data
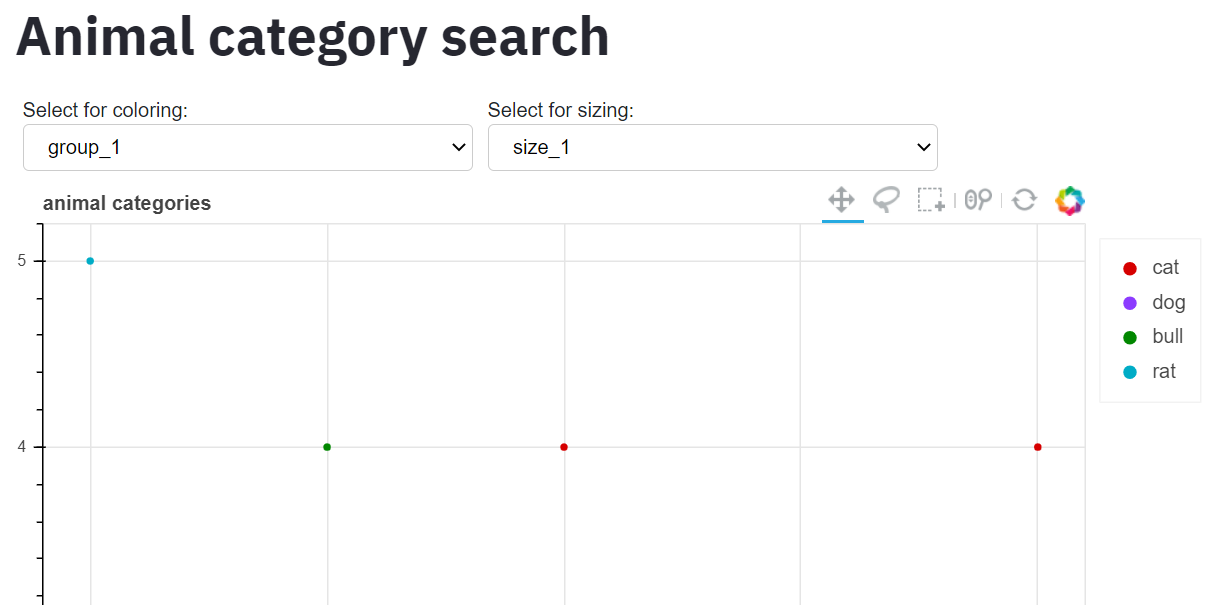
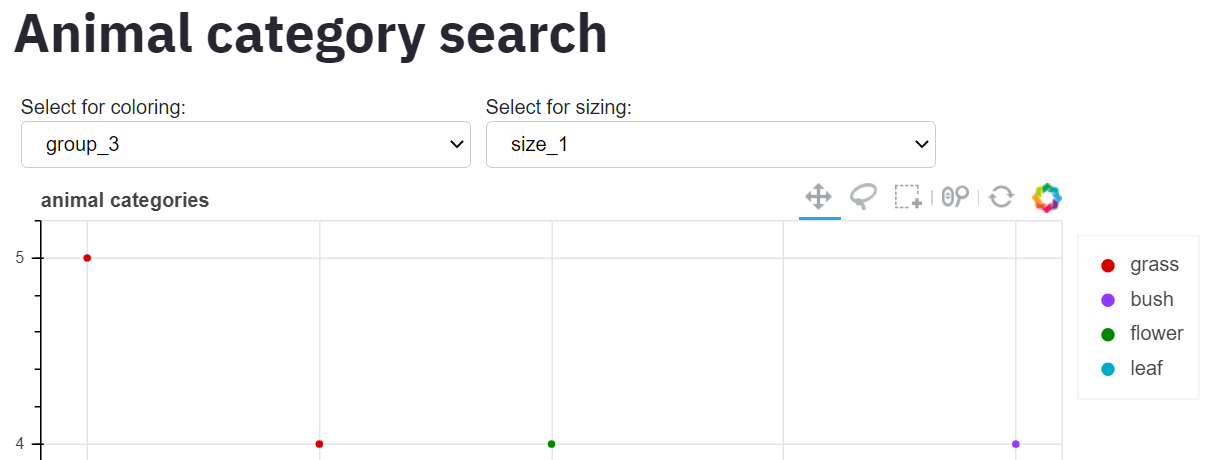
coloring = Select(title="Select for coloring:", value="group_1", options=param_list_1)
color_label = coloring.value

sizing = Select(title="Select for sizing:", value="size_1", options=param_list_2)
sizing_label = sizing.value

palette = glasbey[:len(plot_data[color_label].unique())]

color_map=bokeh.models.CategoricalColorMapper(factors=plot_data[color_label].unique(),palette=palette)

plot_data['Size'] = get_sizer(plot_data[sizing_label], 10, 40)
plot_data['Half_Size'] = plot_data['Size']/1000
source = ColumnDataSource(plot_data.reset_index())

p = figure( plot_width=800, plot_height=600,
    title = st.session_state.model_label,
    tools='''pan,lasso_select,box_select,wheel_zoom,reset''',
    active_scroll = 'wheel_zoom',active_inspect = None,
    toolbar_location = 'above')

p.add_layout(annotations.Legend(), 'right')
p.legend.click_policy = 'hide'

p.scatter(x='1st_Component',y='2nd_Component',
          color={'field': color_label, 'transform': color_map},
          legend=color_cat_label, source=source)

callback = CustomJS(args=dict(source=source,plot=p,coloring=coloring,sizing=sizing), code="""
    var data = source.data
    var a =coloring.value;
    var s = sizing.value;
    var palette = glasbey[:len(data[a].unique())];
    var color_map = bokeh.models.CategoricalColorMapper(factors=data[a].unique(),palette=palette)
    source = ColumnDataSource(data=data)
    plot.color={'field': color_cat_label, 'transform': color_map}
    plot.legend=color_cat_label
    plot.source = source
    plot.change.emit()
    """)

coloring.js_on_change('value', callback)
sizing.js_on_change('value', callback)

event_result = streamlit_bokeh_events(
    events="SelectEvent",
    bokeh_plot=column(row(coloring,sizing,width=800),p),
    key="foo2",
    refresh_on_update=True,
    debounce_time=0,
)

Above code is able to plot with colormap based on groups but not able change if I change coloring select widget value. can someone help me out !!!

Hi @vinayreddy911 please edit your post to use code formatting so that the code is intelligible (either with the </> icon on the editing toolbar, or triple backtick ``` fences around the code blocks)

Hi @Bryan ! could you please check now!!

It’s hard to guess where it goes wrong because the code contains too much fluff and is incomplete, you need to provide an MRE for people to help you properly.

From what I can tell though, you are replacing the CDS (plot.source = source) this won’t work.
You should instead change the data-dictionary inside the CDS.

Like so
from bokeh.io import show
from bokeh.layouts import column
from bokeh.models import CustomJS, Button, ColumnDataSource
from bokeh.plotting import figure

btn = Button(label="click-me")

source = ColumnDataSource(data=dict(x=[0.5], y=[0.5]))

p = figure(plot_width=800, plot_height=600,)
p.circle(source=source, size=10)

callback = CustomJS(args=dict(source=source), code="""
    var data = source.data
    data.x = [Math.random(), Math.random(), Math.random()]
    data.y = [Math.random(), Math.random(), Math.random()]
    source.data = data
    source.change.emit()
    """)

btn.js_on_click(callback)

show(column(btn, p))

It’s hard to help though, because the callback also seems convoluted with various kinds of errors (where did you define color_cat_label?) - I don’t think this problem is related to streamlit.

@vinayreddy911 I don’t have any experience with streamlit, so I can’t really offer any direct guidance about that at all. I agree with @kaprisonne that the best way to utilize the expertise here is to provide a complete, pure-bokeh Minimal Reproducible Example that people can actually copy and paste as-is in order to run to investigate.

Hi @kaprisonne and @Bryan , Firstly thanks for your reply. Here is the minimal working example to understand even more of my code:

import pandas as pd
import streamlit as st
from copy import deepcopy
import numpy as np
from state import provide_state
import bokeh
from streamlit_bokeh_events import streamlit_bokeh_events
from bokeh.layouts import column, row
from bokeh.models import Slider, TextInput,Dropdown,Select,Button
from bokeh.plotting import figure
from bokeh.models import ColumnDataSource, CDSView, annotations, BooleanFilter, CustomJS, HoverTool
from colorcet import glasbey

def get_sizer(X, min_size, max_size):
    X_std = (X - X.min(axis=0)) / (X.max(axis=0) - X.min(axis=0))
    X_scaled = X_std * (max_size - min_size) + min_size
    return X_scaled.fillna(min_size)

my_data = {  'group_1':['cat','dog','cat','dog','bull','bull','cat','rat'],
'group_2':['lion','tiger','deer','tiger','deer','deer','lion','lion'],
'group_3':['grass','bush','flower','leaf','grass','leaf','bush','grass'],
'length':[5,6,5,6,4,3,7,3],
'length_1':[25,36,45,36,54,43,76,37],
'width':[1,2,4,3,4,2,4,5],
'width_1':[11,12,14,13,14,12,14,15],
'size_1': [10,23,45,12,10,45,43,29]
}

st.set_page_config(
    layout="wide",
    page_title="Reference Search",
)
st.write('''# Animal category search''')
st.session_state.data = my_data.copy()
plot_data = pd.DataFrame(st.session_state.data )

coloring = Select(title="Select for coloring:", value="group_1", options=['group_1','group_2','group_3'])
color_label = coloring.value
sizing = Select(title="Select for sizing:", value="size_1", options=['length','length_1','width','width_1','size_1'])
sizing_label = sizing.value

palette = glasbey[:len(plot_data[color_label].unique())]
color_map = bokeh.models.CategoricalColorMapper(factors=plot_data[color_label].unique(),palette=palette)
plot_data['Size'] = get_sizer(plot_data[sizing_label], 10, 40)
plot_data['Half_Size'] = plot_data['Size']/1000

source = ColumnDataSource(plot_data.reset_index().rename(columns={'index':'Animal'}))
print(source.data)
p = figure( plot_width=800, plot_height=600,
    title = 'animal categories',
    tools='''pan,lasso_select,box_select,wheel_zoom,reset''',
    active_scroll = 'wheel_zoom',active_inspect = None,
    toolbar_location = 'above'
)
p.add_layout(annotations.Legend(), 'right')
p.legend.click_policy = 'hide'

p.scatter(x='length',y='width',
          color={'field': color_label, 'transform': color_map},
          legend=color_label, source=source)

callback = CustomJS(args=dict(source=source,plot=p,coloring=coloring,sizing=sizing), code="""
    var data = source.data
    var a =coloring.value;
    var s = sizing.value;
    var palette = glasbey[:len(data[a].unique())];
    var color_map = bokeh.models.CategoricalColorMapper(factors=data[a].unique(),palette=palette)
    plot.color={'field': color_cat_label, 'transform': color_map}
    plot.legend=color_cat_label
    plot.change.emit()
    """)
coloring.js_on_change('value', callback)
sizing.js_on_change('value', callback)

streamlit_bokeh_events(
    events="SelectEvent",
    bokeh_plot=column(row(coloring,sizing,width=800),p),
    key="foo2",
    refresh_on_update=True,
    debounce_time=0,
)

It is able to produce a scatter plot with colourmap based on grouping initially, but not updating the plot once the grouping parameters for colourmap has changed through a select widget. initially let’s only concentrate on colouring widget, I am working on functionality to update my plot besed on select widgets colour group categories.
To be precise, I am not able to write proper CustomJS callback to update my plot.
when we only stick to coring widget change, there is no change in the source data x and y values. so, please do help me in writing proper CustomJS callback.

Please mention your bokeh version next time (I presume its 2.0.0).
There’s a bunch of things wrong with your callback. Most notably you are using python code in a JavaScript-code snippet.

I suggest reiterating the examples in the standalone bokeh gallery, like this one slider.py — Bokeh 2.4.2 Documentation .

Here’s a snippet that does what you want with the coloring, if I understood your intentions correctly.

Try this
import pandas as pd
import streamlit as st
from copy import deepcopy
import numpy as np
import bokeh
from streamlit_bokeh_events import streamlit_bokeh_events
from bokeh.layouts import column, row
from bokeh.models import Slider, TextInput,Dropdown,Select,Button
from bokeh.plotting import figure
from bokeh.models import ColumnDataSource, CDSView, annotations, BooleanFilter, CustomJS, HoverTool
from colorcet import glasbey

def get_sizer(X, min_size, max_size):
    X_std = (X - X.min(axis=0)) / (X.max(axis=0) - X.min(axis=0))
    X_scaled = X_std * (max_size - min_size) + min_size
    return X_scaled.fillna(min_size)

my_data = {
    'group_1':['cat','dog','cat','dog','bull','bull','cat','rat'],
    'group_2':['lion','tiger','deer','tiger','deer','deer','lion','lion'],
    'group_3':['grass','bush','flower','leaf','grass','leaf','bush','grass'],
    'length':[5,6,5,6,4,3,7,3],
    'length_1':[25,36,45,36,54,43,76,37],
    'width':[1,2,4,3,4,2,4,5],
    'width_1':[11,12,14,13,14,12,14,15],
    'size_1': [10,23,45,12,10,45,43,29]
}

st.set_page_config(
    layout="wide",
    page_title="Reference Search",
)
st.write('''# Animal category search''')
st.session_state.data = my_data.copy()
plot_data = pd.DataFrame(st.session_state.data )

coloring = Select(title="Select for coloring:", value="group_1", options=['group_1','group_2','group_3'])
color_label = coloring.value
sizing = Select(title="Select for sizing:", value="size_1", options=['length','length_1','width','width_1','size_1'])
sizing_label = sizing.value

palette = glasbey[:len(plot_data[color_label].unique())]
color_map = bokeh.models.CategoricalColorMapper(factors=plot_data[color_label].unique(),palette=palette)
plot_data['Size'] = get_sizer(plot_data[sizing_label], 10, 40)
plot_data['Half_Size'] = plot_data['Size']/1000

source = ColumnDataSource(plot_data.reset_index().rename(columns={'index':'Animal'}))
p = figure( plot_width=800, plot_height=600,
    title = 'animal categories',
    tools= 'pan, lasso_select, box_select, wheel_zoom, reset',
    toolbar_location = 'above'
)
p.add_layout(annotations.Legend(), 'right')
p.legend.click_policy = 'hide'

scatter0 = p.scatter(x='length',y='width',
          color={'field': 'group_1', 'transform': color_map},
          legend='group_1', source=source, name="group_1")

scatter1 = p.scatter(x='length',y='width',
          color={'field': 'group_2', 'transform': color_map},
          legend='group_2', source=source, name="group_2", visible=False)

scatter2 = p.scatter(x='length',y='width',
          color={'field': 'group_3', 'transform': color_map},
          legend='group_3', source=source, name="group_3", visible=False)

my_scatters = [scatter0, scatter1, scatter2]

callback = CustomJS(args=dict(source=source,plot=p,coloring=coloring,sizing=sizing, my_palette=glasbey, my_color_map=color_map, my_scatter_plot=my_scatters), code="""
    var data = source.data
    // get unique names using Set
    const unique_names = [... new Set(source.data[coloring.value])]
    const palette = my_palette.slice(0, unique_names.length)
    
    // update color_mapper
    my_color_map.palette=palette
    my_color_map.factors=unique_names
    my_color_map.change.emit()
    
    // show only the group selected by the coloring-seclet
    my_scatter_plot.forEach(function(scatter_glyph){
        scatter_glyph.visible = (scatter_glyph.name == coloring.value)
    });
    """)
coloring.js_on_change('value', callback)
sizing.js_on_change('value', callback)

result = streamlit_bokeh_events(
    events="SelectEvent",
    bokeh_plot=column(row(coloring,sizing,width=800),p),
    key="foo2",
    refresh_on_update=True,
    debounce_time=0,
)

Thank you so much @kaprisonne . you are almost made my functionality. Firstly I am using bokeh 2.2.0 version. Then coming to functionality, you suggested a separate scatter plot for each grouping column and made it visible according to the selected coloring group. Because of this, I am able to see all the groups(3 groups type values) on the legend of the plot i.e 11 legend elements in all cases. This is okay for this minimal example code, whereas if I have more groups then it is not ideal.

if possible please make a way to use only one scatter plot for all group types and the legend and colour filed may have corresponding group type as shown in the below figures on each selection.
group1:


group2:

group3:

I am thinking a way to achieve this but ended up with no result.
Here is a code snippet I tried:

scatter = p.scatter(x='length',y='width',
          color={'field': color_label, 'transform': color_map},
          legend=color_label, source=source, name=color_label)

callback = CustomJS(args=dict(source=source,plot=p,coloring=coloring,sizing=sizing, my_palette=glasbey, my_color_map=color_map, my_scatter_plot=scatter,my_color_label=color_label), code="""
    var data = source.data
    // get unique names using Set
    const unique_names = [... new Set(source.data[coloring.value])]
    const palette = my_palette.slice(0, unique_names.length)

    // update legend and color field
    my_color_label = coloring.value
    my_color_label.change.emit()
    
    // update color_mapper
    my_color_map.palette=palette
    my_color_map.factors=unique_names
    my_color_map.change.emit()

the rest of the code is the same as you suggested above.
Thanks in advance. I hope I am not bothering you with this additional functionality. :blush:

This is a way to only show the currently active legend using the approach with multiple scatter plots.

If you wish to use only one scatter plot you’ll have to do some experimenting yourself.

Code
import pandas as pd
import streamlit as st
from copy import deepcopy
import numpy as np
import bokeh
from streamlit_bokeh_events import streamlit_bokeh_events
from bokeh.layouts import column, row
from bokeh.models import Slider, TextInput,Dropdown,Select,Button
from bokeh.plotting import figure
from bokeh.models import ColumnDataSource, CDSView, annotations, BooleanFilter, CustomJS, HoverTool
from colorcet import glasbey

def get_sizer(X, min_size, max_size):
    X_std = (X - X.min(axis=0)) / (X.max(axis=0) - X.min(axis=0))
    X_scaled = X_std * (max_size - min_size) + min_size
    return X_scaled.fillna(min_size)

my_data = {
    'group_1':['cat','dog','cat','dog','bull','bull','cat','rat'],
    'group_2':['lion','tiger','deer','tiger','deer','deer','lion','lion'],
    'group_3':['grass','bush','flower','leaf','grass','leaf','bush','grass'],
    'length':[5,6,5,6,4,3,7,3],
    'length_1':[25,36,45,36,54,43,76,37],
    'width':[1,2,4,3,4,2,4,5],
    'width_1':[11,12,14,13,14,12,14,15],
    'size_1': [10,23,45,12,10,45,43,29]
}

st.set_page_config(
    layout="wide",
    page_title="Reference Search",
)
st.write('''# Animal category search''')
st.session_state.data = my_data.copy()
plot_data = pd.DataFrame(st.session_state.data )

coloring = Select(title="Select for coloring:", value="group_1", options=['group_1','group_2','group_3'])
color_label = coloring.value
sizing = Select(title="Select for sizing:", value="size_1", options=['length','length_1','width','width_1','size_1'])
sizing_label = sizing.value

palette = glasbey[:len(plot_data[color_label].unique())]
color_map = bokeh.models.CategoricalColorMapper(factors=plot_data[color_label].unique(),palette=palette)
plot_data['Size'] = get_sizer(plot_data[sizing_label], 10, 40)
plot_data['Half_Size'] = plot_data['Size']/1000

source = ColumnDataSource(plot_data.reset_index().rename(columns={'index':'Animal'}))
p = figure( plot_width=800, plot_height=600,
    title = 'animal categories',
    tools= 'pan, lasso_select, box_select, wheel_zoom, reset',
    toolbar_location = 'above'
)
legend=annotations.Legend()
p.add_layout(legend, 'right')
p.legend.click_policy = 'hide'

scatter0 = p.scatter(x='length',y='width',
          color={'field': 'group_1', 'transform': color_map},
          legend='group_1', source=source, name="group_1")

scatter1 = p.scatter(x='length',y='width',
          color={'field': 'group_2', 'transform': color_map},
          legend='group_2', source=source, name="group_2", visible=False)

scatter2 = p.scatter(x='length',y='width',
          color={'field': 'group_3', 'transform': color_map},
          legend='group_3', source=source, name="group_3", visible=False)

my_scatters = [scatter0, scatter1, scatter2]

all_legend_items = legend.items.copy()
legend.items = [item for item in legend.items if item.label['field']=="group_1"]
callback = CustomJS(args=dict(source=source,plot=p,coloring=coloring,sizing=sizing, my_palette=glasbey, my_color_map=color_map, my_scatter_plot=my_scatters, my_legend=legend, legend_items=all_legend_items), code="""
    var data = source.data
    // get unique names using Set
    const unique_names = [... new Set(source.data[coloring.value])]
    const palette = my_palette.slice(0, unique_names.length)
    const selected_group = coloring.value

    // update color_mapper
    my_color_map.palette=palette
    my_color_map.factors=unique_names
    my_color_map.change.emit()

    var legend_items_to_display = []
    legend_items.some(function(legend_item) {
        if (legend_item.label.field == selected_group){
            legend_items_to_display = [legend_item]
            return true
        }
    })
    my_legend.items = legend_items_to_display

    // show only the group selected by the coloring-select
    my_scatter_plot.forEach(function(scatter_glyph){
        let visible = (scatter_glyph.name == selected_group)
        scatter_glyph.visible = visible
    });
    """)
coloring.js_on_change('value', callback)
sizing.js_on_change('value', callback)

result = streamlit_bokeh_events(
    events="SelectEvent",
    bokeh_plot=column(row(coloring,sizing,width=800),p),
    key="foo2",
    refresh_on_update=True,
    debounce_time=0,
)
1 Like

Thank you so much @kaprisonne . your suggested code is working and almost fulfilling my functionality. I will do some experiments to make use of only one scatter plot for all the cases.
Thanks again for all the suggestions and immediate responses every time.

This topic was automatically closed 90 days after the last reply. New replies are no longer allowed.