Thank you so much @kaprisonne . you are almost made my functionality. Firstly I am using bokeh 2.2.0 version. Then coming to functionality, you suggested a separate scatter plot for each grouping column and made it visible according to the selected coloring group. Because of this, I am able to see all the groups(3 groups type values) on the legend of the plot i.e 11 legend elements in all cases. This is okay for this minimal example code, whereas if I have more groups then it is not ideal.
if possible please make a way to use only one scatter plot for all group types and the legend and colour filed may have corresponding group type as shown in the below figures on each selection.
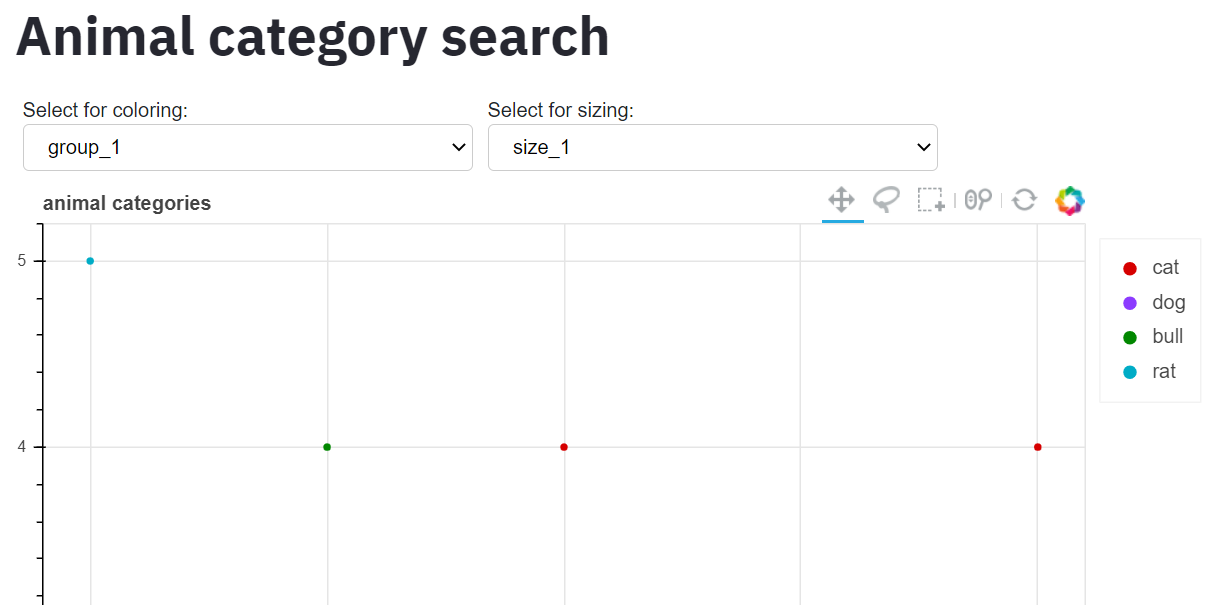
group1:
group2:

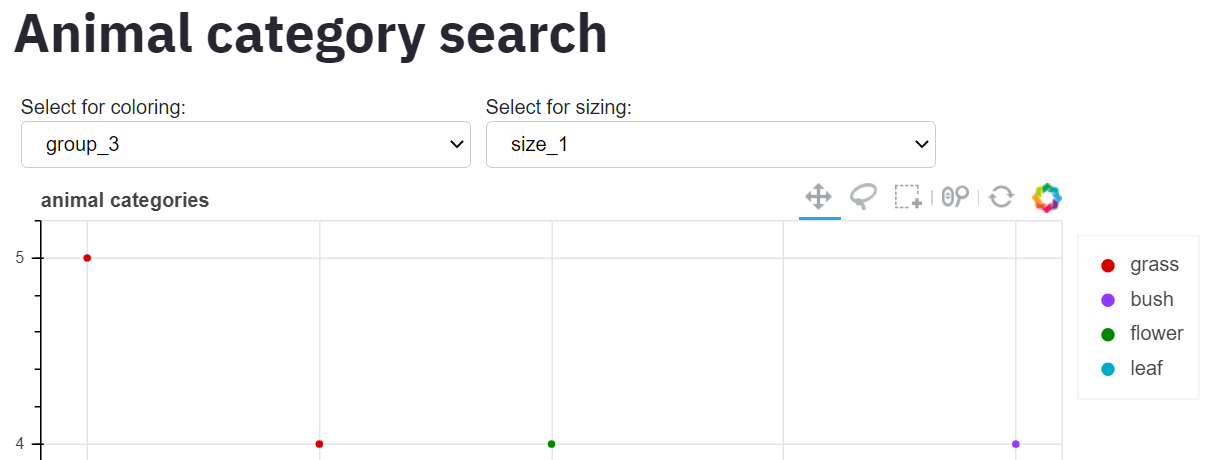
group3:
I am thinking a way to achieve this but ended up with no result.
Here is a code snippet I tried:
scatter = p.scatter(x='length',y='width',
          color={'field': color_label, 'transform': color_map},
          legend=color_label, source=source, name=color_label)

callback = CustomJS(args=dict(source=source,plot=p,coloring=coloring,sizing=sizing, my_palette=glasbey, my_color_map=color_map, my_scatter_plot=scatter,my_color_label=color_label), code="""
    var data = source.data
    // get unique names using Set
    const unique_names = [... new Set(source.data[coloring.value])]
    const palette = my_palette.slice(0, unique_names.length)

    // update legend and color field
    my_color_label = coloring.value
    my_color_label.change.emit()

    // update color_mapper
    my_color_map.palette=palette
    my_color_map.factors=unique_names
    my_color_map.change.emit()
the rest of the code is the same as you suggested above.
Thanks in advance. I hope I am not bothering you with this additional functionality. 