CustomJS for selected indicies after region selection in multi_line model

Hi.
I want to select a region in a multi_line chart and use js code to calculate some statistics of the selected region.

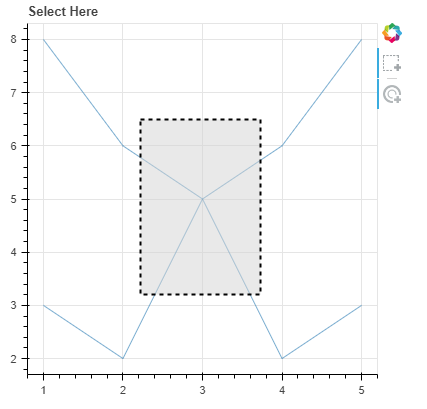
The code below demonstrates what I mean. The issue is that the selection does not call the JS script at all.

What is the suggested and propper way to do it?

from bokeh.models import BoxSelectTool, ColumnDataSource, CustomJS
from bokeh.plotting import figure, show

x = [[1,2,3,4,5], [1,2,3,4,5]]
y = [[8,6,5,2,3], [3,2,5,6,8]]

s1 = ColumnDataSource(data=dict(x0=x, y0=y))
p1 = figure(width=400, height=400, tools="", title="Select Here")
p1.add_tools(BoxSelectTool())
p1.multi_line('x0', 'y0', source=s1, alpha=0.6)

s1.selected.js_on_change('indices', CustomJS(code="""
console.log('selection of a region');
// now calculate some statistics
    """)
)

show(p1)

For example: in the attached selection I would like to have s1.selected.indices = [2]

image

Have you tried multiline_indices? ref selections — Bokeh 3.0.3 Documentation

Or if that does not work maybe one could add a circle glyph with the same data but with alpha = 0 so it is invisible?

Thank you @Jonas_Grave_Kristens
Your solution with adding circles was quite helpful.
I had to convert the multi_line into a series of lines and change the ColumnDataSource formation, but it worked.
I still would like to know if there’s a proper way of selecting indices from lines without imposing another primitive on them.
The example here is simple but in reality I use very complicated displays.

@Nir_G Did you try using multiline_indices instead of indices as suggested? That is the proper way (for multi-lines)

https://docs.bokeh.org/en/latest/docs/reference/models/selections.html#bokeh.models.Selection.multiline_indices

@Bryan, I did

s1.selected.js_on_change('multiline_indices', CustomJS(args=dict(s=s1), code="""
console.log('selection of a region);
console.log(s);
console.log(cb_obj);
// now calculate some statistics

    """)
)

The BoxSelectTool does not select anything and the console is empty.
Am I getting it wrong?

I missed that you were using a box select tool. The multi-line glyphs does not currently support “rect” hit-testing. Please refer to

for details of which glyphs support what kinds of hit-testing.

There is an open issue regarding “rect” hit-testing for line glyphs, please feel free to add any comments there:

Unfortunately, things are complicated by the fact that, in general, neither of the endpoints of a given line segment are necessarily in the selection region (or even in the current viewport).

I’ve also left a comment on:

Since it seems like a select on vertices only (i,e. a multi-scatter) is more in line with what you actually want (and also possibly more likely in the short term).

Thanx @Bryan I thought I might get this answer but I was hoping I wouldn’t.
The document you referred to says that multi_line can use span for the hit test. What is the meaning of this? I am restricting the BoxSelectioTool to its width dimension BoxSelectTool(dimensions='width') is this not considered a span?

No, “span” hit testing is special-cased, and specifically most commonly used for mode="vline" or mode="hline" for the hover tool. See e.g. the timeseries example at the bottom of

https://docs.bokeh.org/en/latest/docs/user_guide/interaction/tools.html#formatting-tooltip-fields

where the hover “hits” from anywhere above or below the timeseries lines.

Edit: to clarify, there is not any built-in selection tool that uses “span” hit-testing. Span hit-testing is currently only used by the hover tool. (In principle, someone could create a custom extension that used span hit-testing for selections, if they desired)

Ok thanx, a lot.
I read your comment at https://github.com/bokeh/bokeh/issues/12367#issuecomment-1370149836. This is exactly what I need. Only selecting the vertices. Such a mode in the Selection tools will be great.

I will probably take this challenge.

This topic was automatically closed 90 days after the last reply. New replies are no longer allowed.