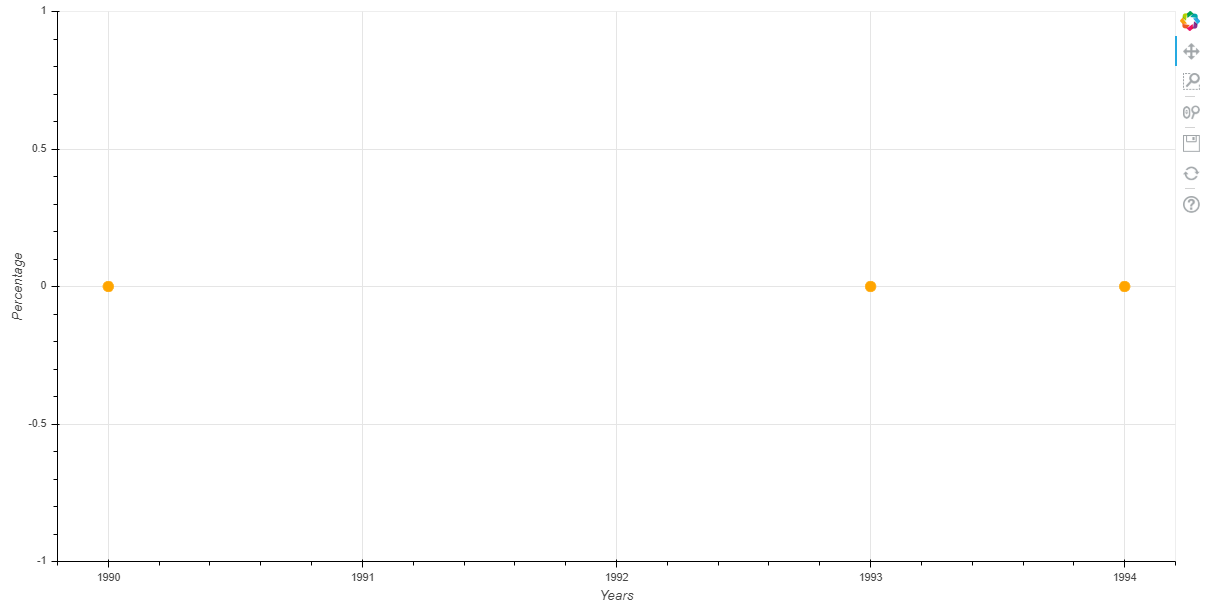
I have two columns, one contains dates and the other percentages. All the data is properly rendered when using a line graph but when I use a scatter plot only the 0 values from the percentages column are plotted. As a new member I can only upload one photo so I have the incorrect graph below. If I plot the same data using a line graph all the data shows up, is this a misunderstanding on my side on how the scatter plot works
Hi @SVN please also edit your post to use code formatting so that the code is intelligible (either with the </> icon on the editing toolbar, or triple backtick ``` fences around the code blocks)
@SVN I don’t have any explanation for this offhand (and have never seen anything like this reported). Can you provide the CSV file or a part of it? What version of Bokeh are you using BTW?
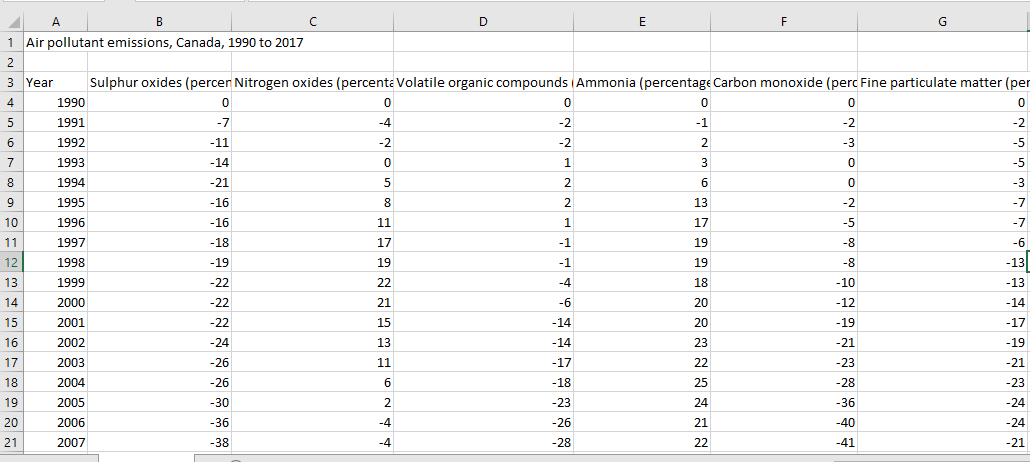
@SVN your CSV file has a ton of unrelated junk in it that is preventing proper parsing by Pandas. The first “title” line, the “notes” at the end. None of that should be in a CSV file. Because of this cruft, Pandas is not properly able to interpret the types of your data, e.g:
In [3]: years
Out[3]:
2     1990
3     1991

< edited >

28    2016
29    2017
Name: Air pollutant emissions, Canada, 1990 to 2017, dtype: object

In [4]: carbonMonoxide
Out[4]:
2       0
3      -2

<edited>

28    -54
29    -54
Name: Unnamed: 5, dtype: object
Notice the dtype is object, instead of some actual numeric type that it should be. This is almost certainly the root cause of what you are observing with Bokeh (I’m suprised it works at all, in any fashion, with object dtypes)
One red flag was also these lines:
years = stats.iloc[2:30,0]
carbonMonoxide = stats.iloc[2:30,5]
You should really never need hacky things like this. A CSV file should contain the data, and optionally the column headers, and nothing else. If you really can’t delete that junk from the file entirely, you will need to find a way to filter it out before Pandas loads it.
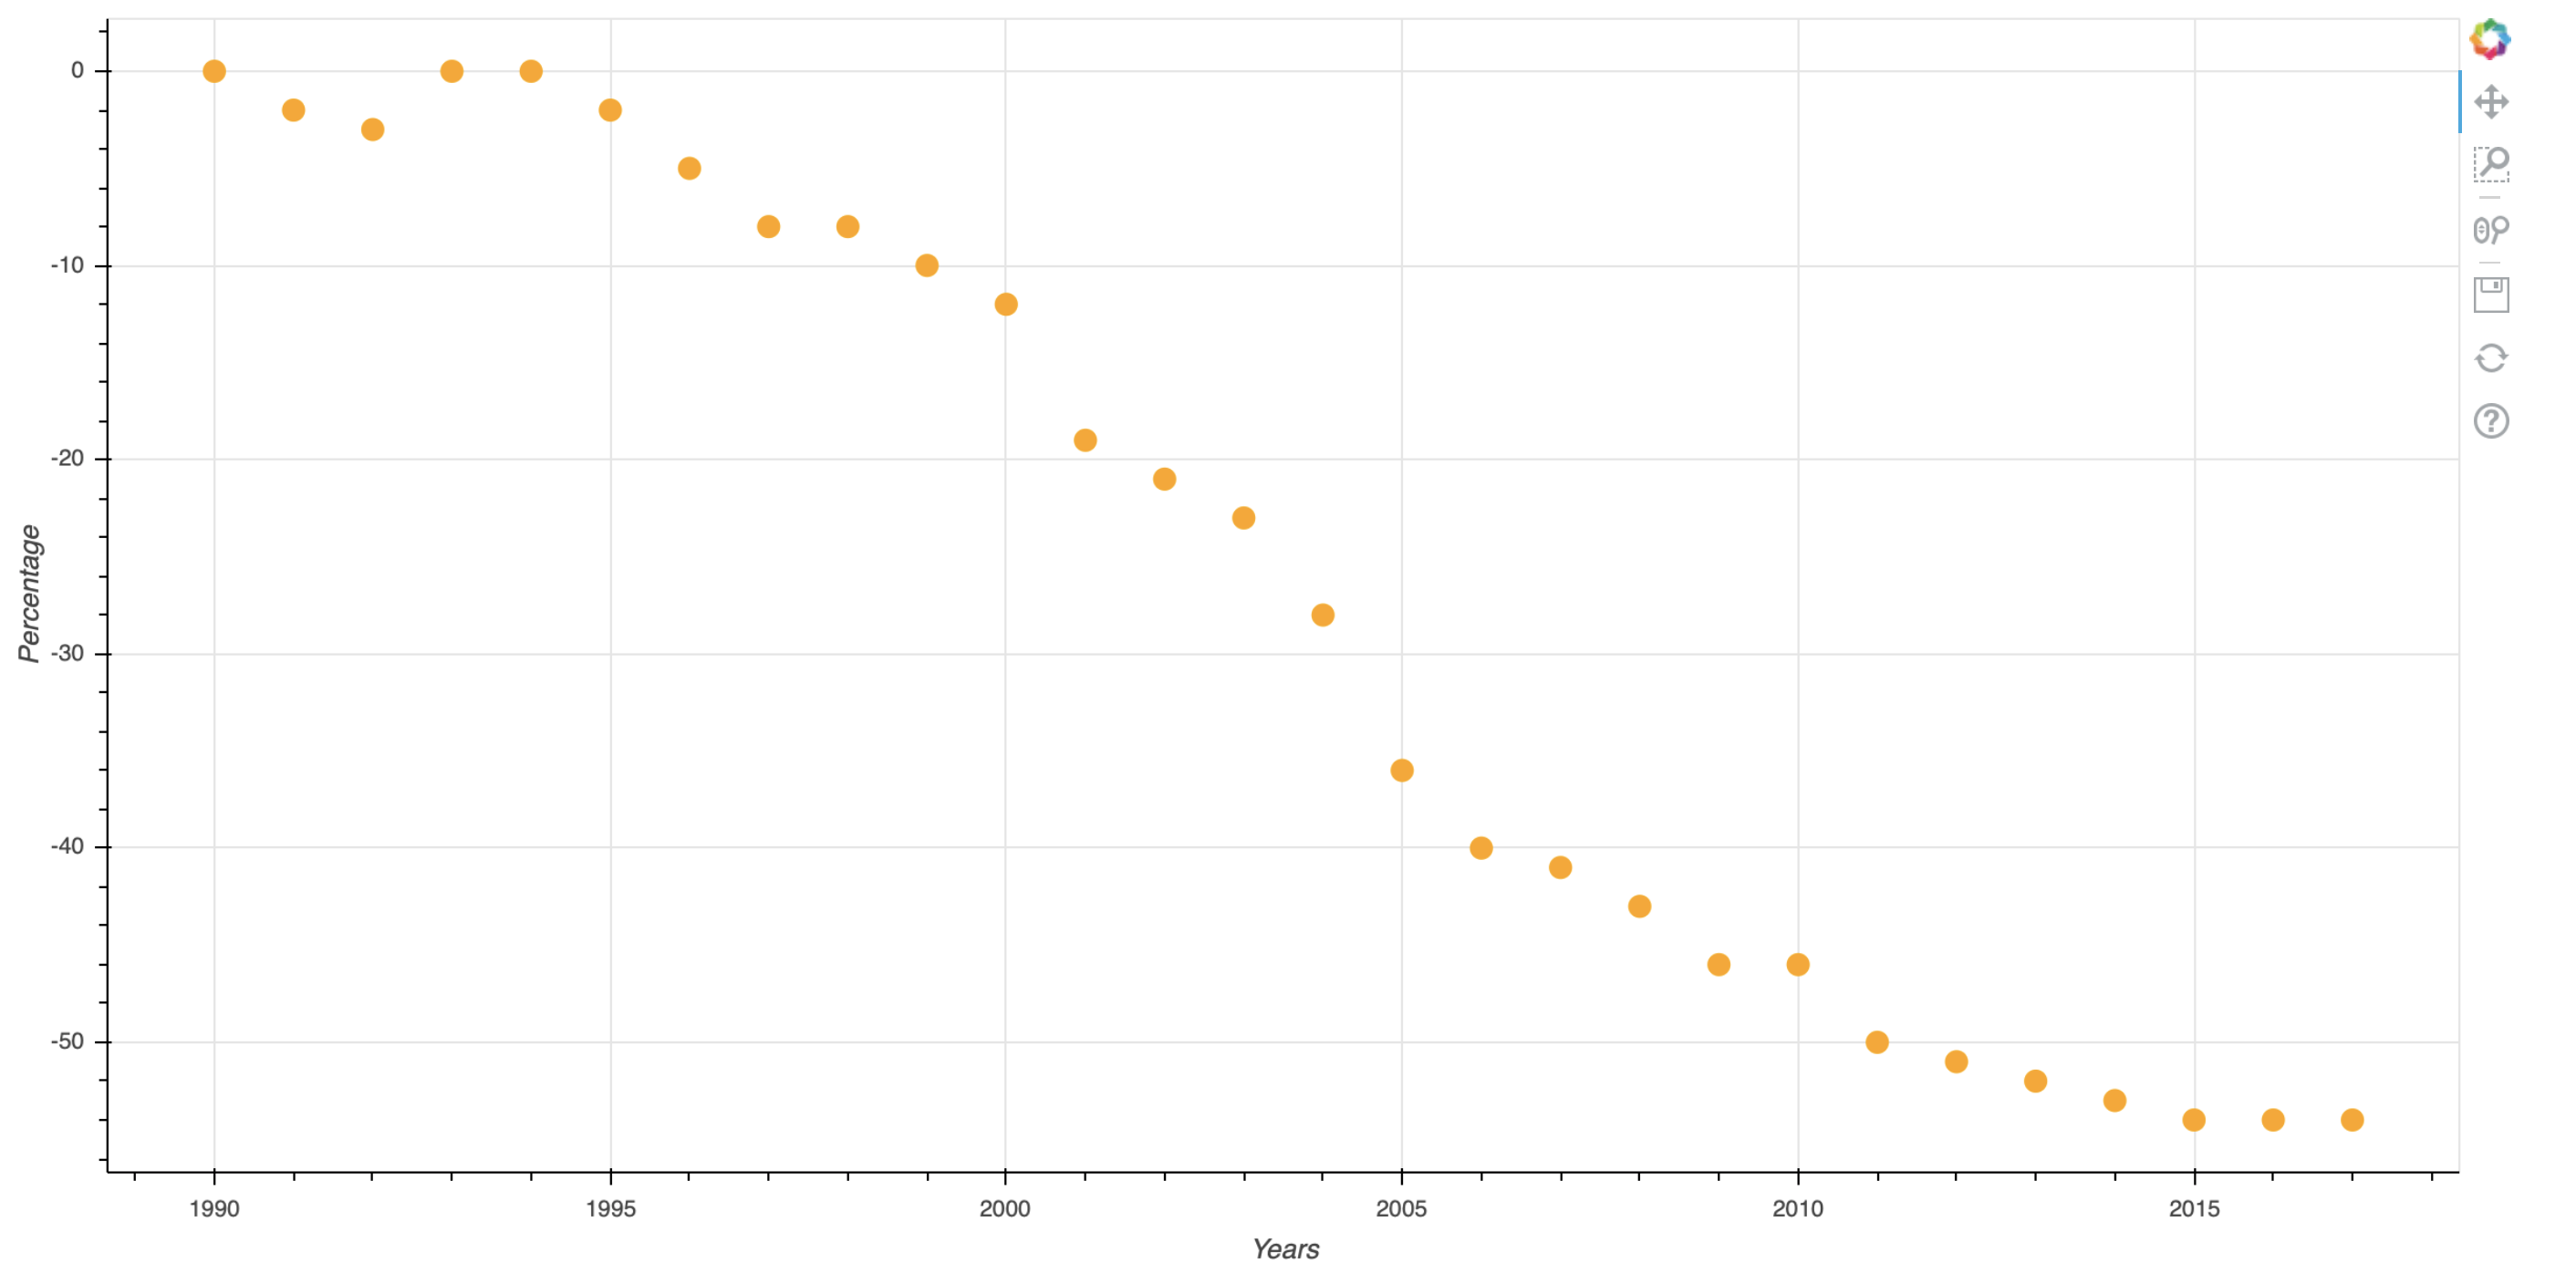
And noting: if I delete all the extraneous lines at the top and the bottom of the file, then Pandas is able to properly infer real Int64 types for the columns, which means Bokeh is also able to plot just fine as expected:
Thanks so much, I retrieved this data from a public government database I don’t know why they added all that extra stuff to the CSV file. I removed it and it’s working perfectly. Thanks again
FWIW, Pandas can read such CSV files but you have to explicitly provide its read_csv function with the correct skiprows and skipfooter arguments. A quite useful feature, given the amount of malformed CSV files out there.